

3.11.2 The Yeast Alcohol
Dehydrogenase (ADH)
1. Weigh 1.6 mg of alcohol dehydrogenase from Saccharomyces
Cerevisiae (Sigma-Aldrich). Resuspend in 280 μL of 200 mM
ammonium acetate to reach a tetrameric concentration of
40 μM.
2. Connect the TriVersa Nanomate™ to the Q-Exactive™ Biopharma Orbitrap as explained in Subheading 3.4.
3. In Excalibur Tune window, manually set the following
parameters:
Operate the instrument in positive mode with an m/z
range from 2,500 to 8,000.
Intact protein mode: off; HRM mode: on; resolution:
15,000; Micro Scan Count: 10; Max. Ion Time: 200 ms;
AGC target: 3e6, S-Lens RF Level: 200, Capillary Temperature: 320
C, Capillary Voltage: 4.4 kV.
Save these parameters as an .mstune file.
4. Start a 2-min acquisition in the 2,500–8,000 m/z range and
analyze data.
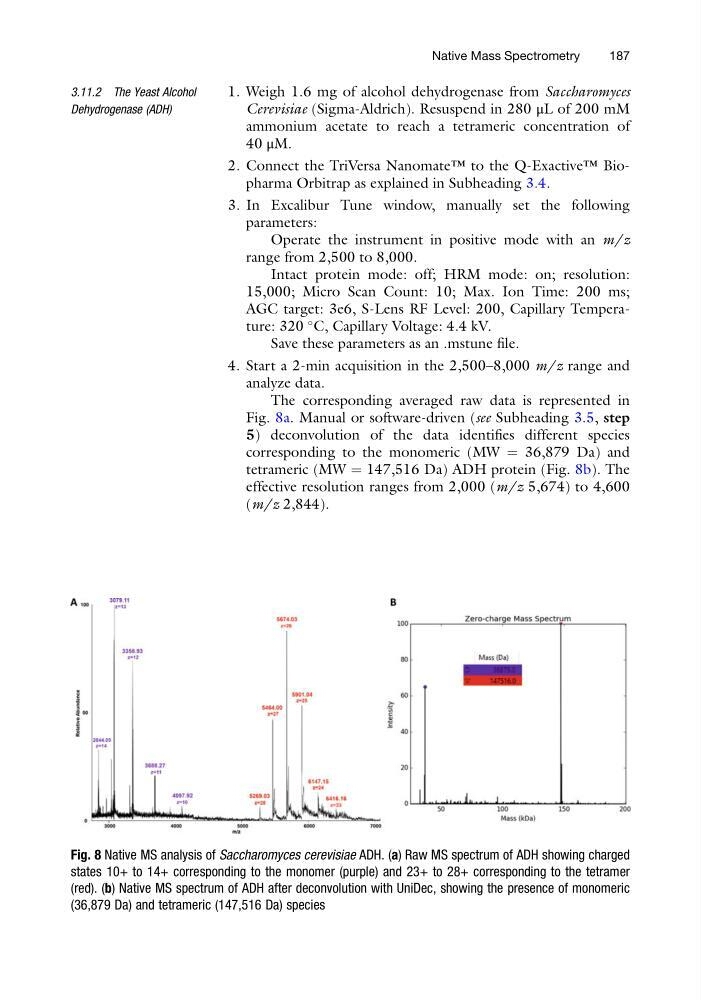
The corresponding averaged raw data is represented in
Fig. 8a. Manual or software-driven (see Subheading 3.5, step
5) deconvolution of the data identifies different species
corresponding to the monomeric (MW ¼ 36,879 Da) and
tetrameric (MW ¼ 147,516 Da) ADH protein (Fig. 8b). The
effective resolution ranges from 2,000 (m/z 5,674) to 4,600
(m/z 2,844).
Fig. 8 Native MS analysis of Saccharomyces cerevisiae ADH. (a) Raw MS spectrum of ADH showing charged
states 10+ to 14+ corresponding to the monomer (purple) and 23+ to 28+ corresponding to the tetramer
(red). (b) Native MS spectrum of ADH after deconvolution with UniDec, showing the presence of monomeric
(36,879 Da) and tetrameric (147,516 Da) species
Native Mass Spectrometry
187
Dehydrogenase (ADH)
1. Weigh 1.6 mg of alcohol dehydrogenase from Saccharomyces
Cerevisiae (Sigma-Aldrich). Resuspend in 280 μL of 200 mM
ammonium acetate to reach a tetrameric concentration of
40 μM.
2. Connect the TriVersa Nanomate™ to the Q-Exactive™ Biopharma Orbitrap as explained in Subheading 3.4.
3. In Excalibur Tune window, manually set the following
parameters:
Operate the instrument in positive mode with an m/z
range from 2,500 to 8,000.
Intact protein mode: off; HRM mode: on; resolution:
15,000; Micro Scan Count: 10; Max. Ion Time: 200 ms;
AGC target: 3e6, S-Lens RF Level: 200, Capillary Temperature: 320
C, Capillary Voltage: 4.4 kV.
Save these parameters as an .mstune file.
4. Start a 2-min acquisition in the 2,500–8,000 m/z range and
analyze data.
The corresponding averaged raw data is represented in
Fig. 8a. Manual or software-driven (see Subheading 3.5, step
5) deconvolution of the data identifies different species
corresponding to the monomeric (MW ¼ 36,879 Da) and
tetrameric (MW ¼ 147,516 Da) ADH protein (Fig. 8b). The
effective resolution ranges from 2,000 (m/z 5,674) to 4,600
(m/z 2,844).
Fig. 8 Native MS analysis of Saccharomyces cerevisiae ADH. (a) Raw MS spectrum of ADH showing charged
states 10+ to 14+ corresponding to the monomer (purple) and 23+ to 28+ corresponding to the tetramer
(red). (b) Native MS spectrum of ADH after deconvolution with UniDec, showing the presence of monomeric
(36,879 Da) and tetrameric (147,516 Da) species
Native Mass Spectrometry
187