

66
J. Kumar V. and K. A. Reddy
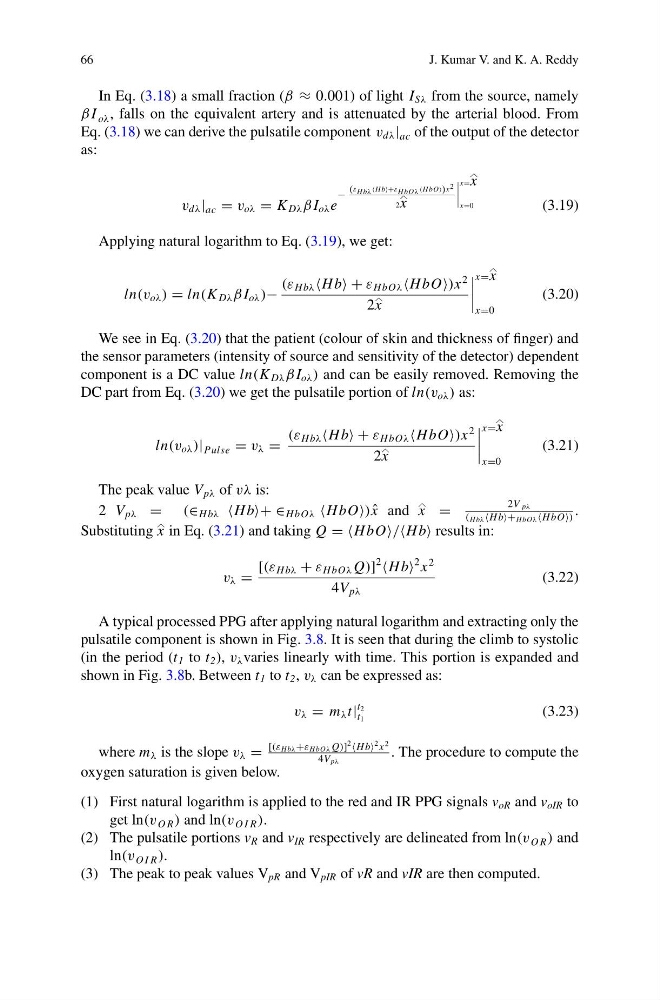
In Eq. (3.18) a small fraction (β ≈ 0.001) of light I Sλ from the source, namely
β I oλ , falls on the equivalent artery and is attenuated by the arterial blood. From
Eq. (3.18) we can derive the pulsatile component v dλ | ac of the output of the detector
as:
v dλ | ac = v oλ = K Dλ β I oλ e
− (εHbλHb+εHbOλHbO)x 2
2x
x=x
x=0
(3.19)
Applying natural logarithm to Eq. (3.19), we get:
ln(v oλ ) = ln(K Dλ β I oλ )−
(ε Hbλ Hb + ε HbOλ HbO)x
2
2x
x=x
x=0
(3.20)
We see in Eq. (3.20) that the patient (colour of skin and thickness of finger) and
the sensor parameters (intensity of source and sensitivity of the detector) dependent
component is a DC value ln(K Dλ β I oλ ) and can be easily removed. Removing the
DC part from Eq. (3.20) we get the pulsatile portion of ln(v oλ ) as:
ln(v oλ )| Pulse = v λ =
(ε Hbλ Hb + ε HbOλ HbO)x
2
2x
x=x
x=0
(3.21)
The peak value V pλ of vλ is:
2 V pλ = (∈ Hbλ Hb+ ∈ HbOλ HbO) ˆ
x and x
=
2V pλ
(HbλHb+HbOλHbO)
.
Substituting x
in Eq. (3.21) and taking Q = =HbO/Hb results in:
v λ =
[(ε Hbλ + ε HbOλ Q)]
2
Hb
2 x
2
4V pλ
(3.22)
A typical processed PPG after applying natural logarithm and extracting only the
pulsatile component is shown in Fig. 3.8. It is seen that during the climb to systolic
(in the period (t 1 to t 2 ), v λ varies linearly with time. This portion is expanded and
shown in Fig. 3.8b. Between t 1 to t 2 , v λ can be expressed as:
v λ = m λ t|
t 2
t 1
(3.23)
where m λ is the slope v λ =
[(ε Hbλ +ε HbOλ Q)]
2 Hb
2 x
2
4V pλ
. The procedure to compute the
oxygen saturation is given below.
(1) First natural logarithm is applied to the red and IR PPG signals v oR and v oIR to
get ln(v O R ) and ln(v O I R ).
(2) The pulsatile portions v R and v IR respectively are delineated from ln(v O R ) and
ln(v O I R ).
(3) The peak to peak values V pR and V pIR of vR and vIR are then computed.
J. Kumar V. and K. A. Reddy
In Eq. (3.18) a small fraction (β ≈ 0.001) of light I Sλ from the source, namely
β I oλ , falls on the equivalent artery and is attenuated by the arterial blood. From
Eq. (3.18) we can derive the pulsatile component v dλ | ac of the output of the detector
as:
v dλ | ac = v oλ = K Dλ β I oλ e
− (εHbλHb+εHbOλHbO)x 2
2x
x=x
x=0
(3.19)
Applying natural logarithm to Eq. (3.19), we get:
ln(v oλ ) = ln(K Dλ β I oλ )−
(ε Hbλ Hb + ε HbOλ HbO)x
2
2x
x=x
x=0
(3.20)
We see in Eq. (3.20) that the patient (colour of skin and thickness of finger) and
the sensor parameters (intensity of source and sensitivity of the detector) dependent
component is a DC value ln(K Dλ β I oλ ) and can be easily removed. Removing the
DC part from Eq. (3.20) we get the pulsatile portion of ln(v oλ ) as:
ln(v oλ )| Pulse = v λ =
(ε Hbλ Hb + ε HbOλ HbO)x
2
2x
x=x
x=0
(3.21)
The peak value V pλ of vλ is:
2 V pλ = (∈ Hbλ Hb+ ∈ HbOλ HbO) ˆ
x and x
=
2V pλ
(HbλHb+HbOλHbO)
.
Substituting x
in Eq. (3.21) and taking Q = =HbO/Hb results in:
v λ =
[(ε Hbλ + ε HbOλ Q)]
2
Hb
2 x
2
4V pλ
(3.22)
A typical processed PPG after applying natural logarithm and extracting only the
pulsatile component is shown in Fig. 3.8. It is seen that during the climb to systolic
(in the period (t 1 to t 2 ), v λ varies linearly with time. This portion is expanded and
shown in Fig. 3.8b. Between t 1 to t 2 , v λ can be expressed as:
v λ = m λ t|
t 2
t 1
(3.23)
where m λ is the slope v λ =
[(ε Hbλ +ε HbOλ Q)]
2 Hb
2 x
2
4V pλ
. The procedure to compute the
oxygen saturation is given below.
(1) First natural logarithm is applied to the red and IR PPG signals v oR and v oIR to
get ln(v O R ) and ln(v O I R ).
(2) The pulsatile portions v R and v IR respectively are delineated from ln(v O R ) and
ln(v O I R ).
(3) The peak to peak values V pR and V pIR of vR and vIR are then computed.