

3 Pulse Oximetry for the Measurement of Oxygen Saturation …
63
3.8 A Model-Based Calibration-Free Method
for the Measurement of SpO 2
The calibration-free methods of measurement of SpO 2 described below are based
on a model for the attenuation or reflection of light through or from the body and
is applicable for both the transmission and reflectance type of PPG sensors [41,
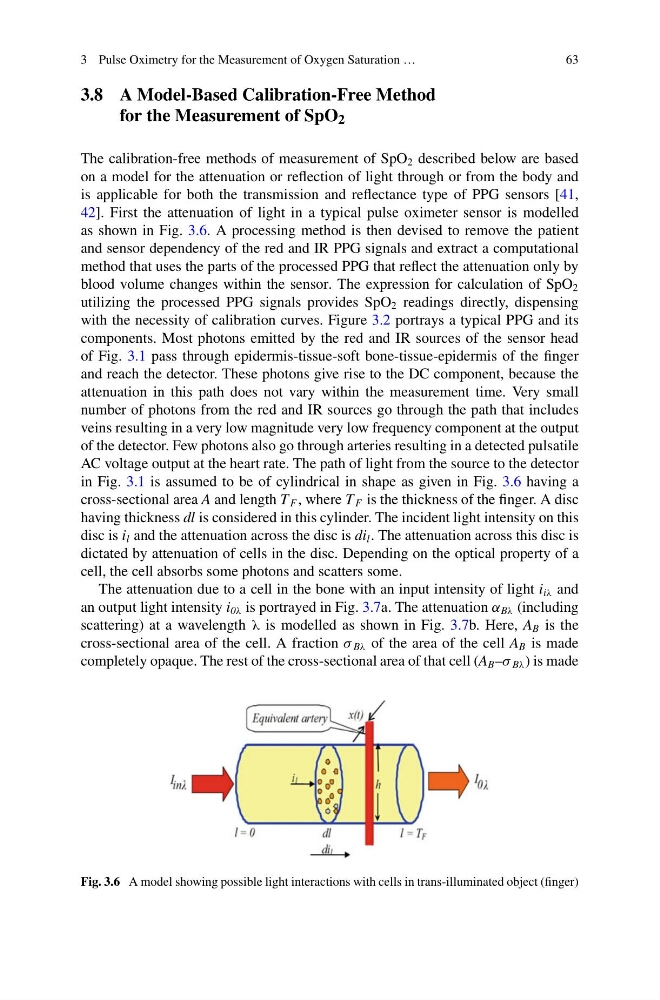
42]. First the attenuation of light in a typical pulse oximeter sensor is modelled
as shown in Fig. 3.6. A processing method is then devised to remove the patient
and sensor dependency of the red and IR PPG signals and extract a computational
method that uses the parts of the processed PPG that reflect the attenuation only by
blood volume changes within the sensor. The expression for calculation of SpO 2
utilizing the processed PPG signals provides SpO 2 readings directly, dispensing
with the necessity of calibration curves. Figure 3.2 portrays a typical PPG and its
components. Most photons emitted by the red and IR sources of the sensor head
of Fig. 3.1 pass through epidermis-tissue-soft bone-tissue-epidermis of the finger
and reach the detector. These photons give rise to the DC component, because the
attenuation in this path does not vary within the measurement time. Very small
number of photons from the red and IR sources go through the path that includes
veins resulting in a very low magnitude very low frequency component at the output
of the detector. Few photons also go through arteries resulting in a detected pulsatile
AC voltage output at the heart rate. The path of light from the source to the detector
in Fig. 3.1 is assumed to be of cylindrical in shape as given in Fig. 3.6 having a
cross-sectional area A and length T F , where T F is the thickness of the finger. A disc
having thickness dl is considered in this cylinder. The incident light intensity on this
disc is i l and the attenuation across the disc is di l . The attenuation across this disc is
dictated by attenuation of cells in the disc. Depending on the optical property of a
cell, the cell absorbs some photons and scatters some.
The attenuation due to a cell in the bone with an input intensity of light i iλ and
an output light intensity i 0λ is portrayed in Fig. 3.7a. The attenuation α Bλ (including
scattering) at a wavelength λ is modelled as shown in Fig. 3.7b. Here, A B is the
cross-sectional area of the cell. A fraction σ Bλ of the area of the cell A B is made
completely opaque. The rest of the cross-sectional area of that cell (A B –σ Bλ ) is made
Fig. 3.6 A model showing possible light interactions with cells in trans-illuminated object (finger)
63
3.8 A Model-Based Calibration-Free Method
for the Measurement of SpO 2
The calibration-free methods of measurement of SpO 2 described below are based
on a model for the attenuation or reflection of light through or from the body and
is applicable for both the transmission and reflectance type of PPG sensors [41,
42]. First the attenuation of light in a typical pulse oximeter sensor is modelled
as shown in Fig. 3.6. A processing method is then devised to remove the patient
and sensor dependency of the red and IR PPG signals and extract a computational
method that uses the parts of the processed PPG that reflect the attenuation only by
blood volume changes within the sensor. The expression for calculation of SpO 2
utilizing the processed PPG signals provides SpO 2 readings directly, dispensing
with the necessity of calibration curves. Figure 3.2 portrays a typical PPG and its
components. Most photons emitted by the red and IR sources of the sensor head
of Fig. 3.1 pass through epidermis-tissue-soft bone-tissue-epidermis of the finger
and reach the detector. These photons give rise to the DC component, because the
attenuation in this path does not vary within the measurement time. Very small
number of photons from the red and IR sources go through the path that includes
veins resulting in a very low magnitude very low frequency component at the output
of the detector. Few photons also go through arteries resulting in a detected pulsatile
AC voltage output at the heart rate. The path of light from the source to the detector
in Fig. 3.1 is assumed to be of cylindrical in shape as given in Fig. 3.6 having a
cross-sectional area A and length T F , where T F is the thickness of the finger. A disc
having thickness dl is considered in this cylinder. The incident light intensity on this
disc is i l and the attenuation across the disc is di l . The attenuation across this disc is
dictated by attenuation of cells in the disc. Depending on the optical property of a
cell, the cell absorbs some photons and scatters some.
The attenuation due to a cell in the bone with an input intensity of light i iλ and
an output light intensity i 0λ is portrayed in Fig. 3.7a. The attenuation α Bλ (including
scattering) at a wavelength λ is modelled as shown in Fig. 3.7b. Here, A B is the
cross-sectional area of the cell. A fraction σ Bλ of the area of the cell A B is made
completely opaque. The rest of the cross-sectional area of that cell (A B –σ Bλ ) is made
Fig. 3.6 A model showing possible light interactions with cells in trans-illuminated object (finger)