

62
J. Kumar V. and K. A. Reddy
% SpO2 = 110 – 25R
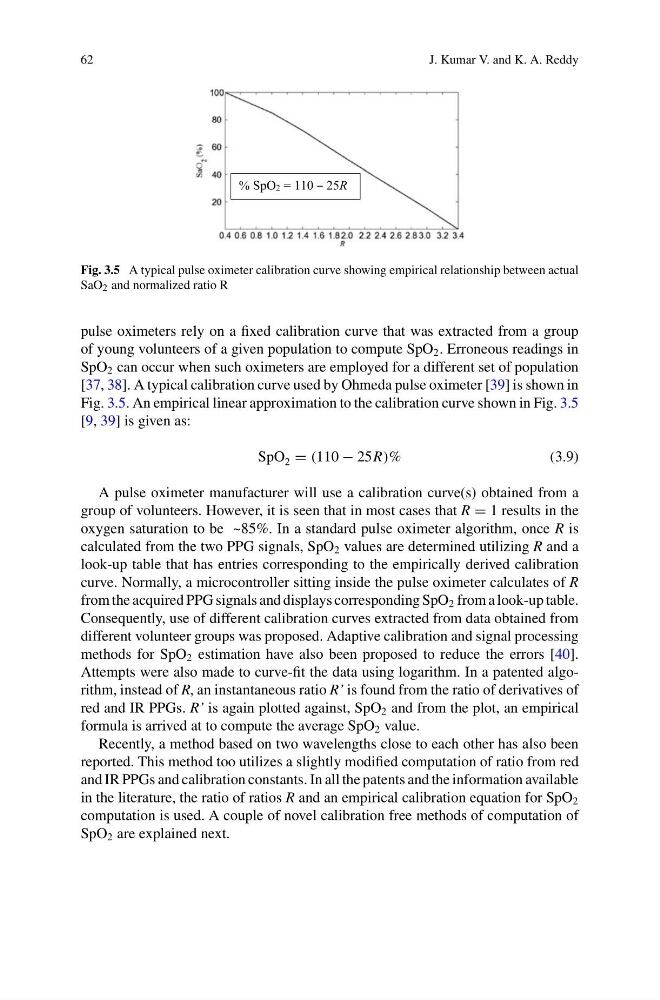
Fig. 3.5 A typical pulse oximeter calibration curve showing empirical relationship between actual
SaO 2 and normalized ratio R
pulse oximeters rely on a fixed calibration curve that was extracted from a group
of young volunteers of a given population to compute SpO 2 . Erroneous readings in
SpO 2 can occur when such oximeters are employed for a different set of population
[37, 38]. A typical calibration curve used by Ohmeda pulse oximeter [39] is shown in
Fig. 3.5. An empirical linear approximation to the calibration curve shown in Fig. 3.5
[9, 39] is given as:
SpO 2 = (110 − 25R)%
(3.9)
A pulse oximeter manufacturer will use a calibration curve(s) obtained from a
group of volunteers. However, it is seen that in most cases that R = 1 results in the
oxygen saturation to be ~85%. In a standard pulse oximeter algorithm, once R is
calculated from the two PPG signals, SpO 2 values are determined utilizing R and a
look-up table that has entries corresponding to the empirically derived calibration
curve. Normally, a microcontroller sitting inside the pulse oximeter calculates of R
from the acquired PPG signals and displays corresponding SpO 2 from a look-up table.
Consequently, use of different calibration curves extracted from data obtained from
different volunteer groups was proposed. Adaptive calibration and signal processing
methods for SpO 2 estimation have also been proposed to reduce the errors [40].
Attempts were also made to curve-fit the data using logarithm. In a patented algorithm, instead of R, an instantaneous ratio R’ is found from the ratio of derivatives of
red and IR PPGs. R’ is again plotted against, SpO 2 and from the plot, an empirical
formula is arrived at to compute the average SpO 2 value.
Recently, a method based on two wavelengths close to each other has also been
reported. This method too utilizes a slightly modified computation of ratio from red
and IR PPGs and calibration constants. In all the patents and the information available
in the literature, the ratio of ratios R and an empirical calibration equation for SpO 2
computation is used. A couple of novel calibration free methods of computation of
SpO 2 are explained next.
J. Kumar V. and K. A. Reddy
% SpO2 = 110 – 25R
Fig. 3.5 A typical pulse oximeter calibration curve showing empirical relationship between actual
SaO 2 and normalized ratio R
pulse oximeters rely on a fixed calibration curve that was extracted from a group
of young volunteers of a given population to compute SpO 2 . Erroneous readings in
SpO 2 can occur when such oximeters are employed for a different set of population
[37, 38]. A typical calibration curve used by Ohmeda pulse oximeter [39] is shown in
Fig. 3.5. An empirical linear approximation to the calibration curve shown in Fig. 3.5
[9, 39] is given as:
SpO 2 = (110 − 25R)%
(3.9)
A pulse oximeter manufacturer will use a calibration curve(s) obtained from a
group of volunteers. However, it is seen that in most cases that R = 1 results in the
oxygen saturation to be ~85%. In a standard pulse oximeter algorithm, once R is
calculated from the two PPG signals, SpO 2 values are determined utilizing R and a
look-up table that has entries corresponding to the empirically derived calibration
curve. Normally, a microcontroller sitting inside the pulse oximeter calculates of R
from the acquired PPG signals and displays corresponding SpO 2 from a look-up table.
Consequently, use of different calibration curves extracted from data obtained from
different volunteer groups was proposed. Adaptive calibration and signal processing
methods for SpO 2 estimation have also been proposed to reduce the errors [40].
Attempts were also made to curve-fit the data using logarithm. In a patented algorithm, instead of R, an instantaneous ratio R’ is found from the ratio of derivatives of
red and IR PPGs. R’ is again plotted against, SpO 2 and from the plot, an empirical
formula is arrived at to compute the average SpO 2 value.
Recently, a method based on two wavelengths close to each other has also been
reported. This method too utilizes a slightly modified computation of ratio from red
and IR PPGs and calibration constants. In all the patents and the information available
in the literature, the ratio of ratios R and an empirical calibration equation for SpO 2
computation is used. A couple of novel calibration free methods of computation of
SpO 2 are explained next.