

3 Pulse Oximetry for the Measurement of Oxygen Saturation …
61
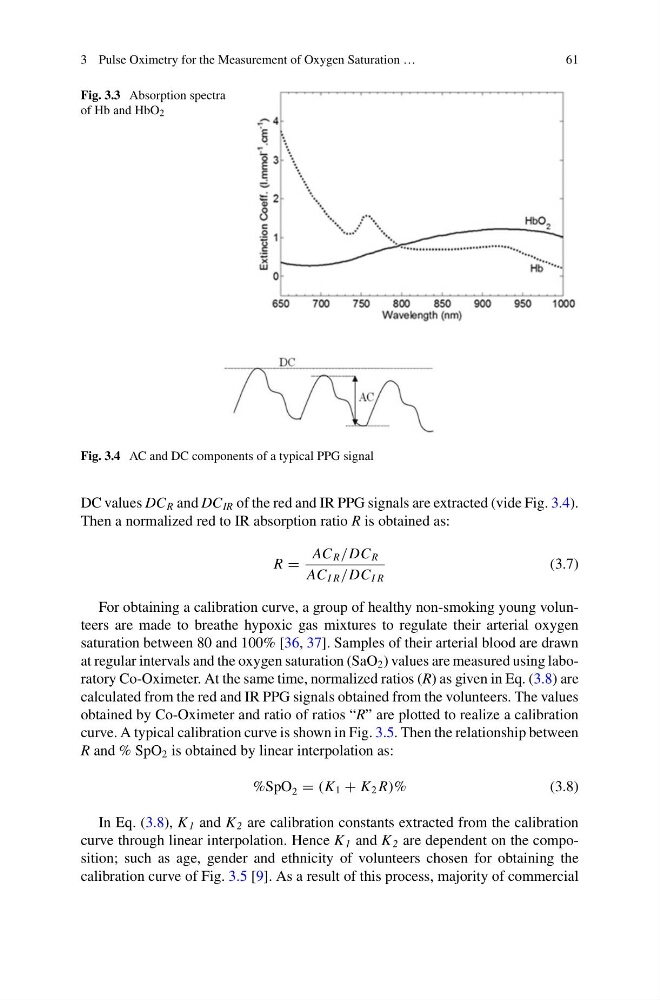
Fig. 3.3 Absorption spectra
of Hb and HbO 2
Fig. 3.4 AC and DC components of a typical PPG signal
DC values DC R and DC IR of the red and IR PPG signals are extracted (vide Fig. 3.4).
Then a normalized red to IR absorption ratio R is obtained as:
R =
AC R /DC R
AC I R /DC I R
(3.7)
For obtaining a calibration curve, a group of healthy non-smoking young volunteers are made to breathe hypoxic gas mixtures to regulate their arterial oxygen
saturation between 80 and 100% [36, 37]. Samples of their arterial blood are drawn
at regular intervals and the oxygen saturation (SaO 2 ) values are measured using laboratory Co-Oximeter. At the same time, normalized ratios (R) as given in Eq. (3.8) are
calculated from the red and IR PPG signals obtained from the volunteers. The values
obtained by Co-Oximeter and ratio of ratios “R” are plotted to realize a calibration
curve. A typical calibration curve is shown in Fig. 3.5. Then the relationship between
R and % SpO 2 is obtained by linear interpolation as:
%SpO 2 = (K 1 + K 2 R)%
(3.8)
In Eq. (3.8), K 1 and K 2 are calibration constants extracted from the calibration
curve through linear interpolation. Hence K 1 and K 2 are dependent on the composition; such as age, gender and ethnicity of volunteers chosen for obtaining the
calibration curve of Fig. 3.5 [9]. As a result of this process, majority of commercial
61
Fig. 3.3 Absorption spectra
of Hb and HbO 2
Fig. 3.4 AC and DC components of a typical PPG signal
DC values DC R and DC IR of the red and IR PPG signals are extracted (vide Fig. 3.4).
Then a normalized red to IR absorption ratio R is obtained as:
R =
AC R /DC R
AC I R /DC I R
(3.7)
For obtaining a calibration curve, a group of healthy non-smoking young volunteers are made to breathe hypoxic gas mixtures to regulate their arterial oxygen
saturation between 80 and 100% [36, 37]. Samples of their arterial blood are drawn
at regular intervals and the oxygen saturation (SaO 2 ) values are measured using laboratory Co-Oximeter. At the same time, normalized ratios (R) as given in Eq. (3.8) are
calculated from the red and IR PPG signals obtained from the volunteers. The values
obtained by Co-Oximeter and ratio of ratios “R” are plotted to realize a calibration
curve. A typical calibration curve is shown in Fig. 3.5. Then the relationship between
R and % SpO 2 is obtained by linear interpolation as:
%SpO 2 = (K 1 + K 2 R)%
(3.8)
In Eq. (3.8), K 1 and K 2 are calibration constants extracted from the calibration
curve through linear interpolation. Hence K 1 and K 2 are dependent on the composition; such as age, gender and ethnicity of volunteers chosen for obtaining the
calibration curve of Fig. 3.5 [9]. As a result of this process, majority of commercial