

2 Influence of Controlled Breathing (Pranayama) on Dermal Perfusion
43
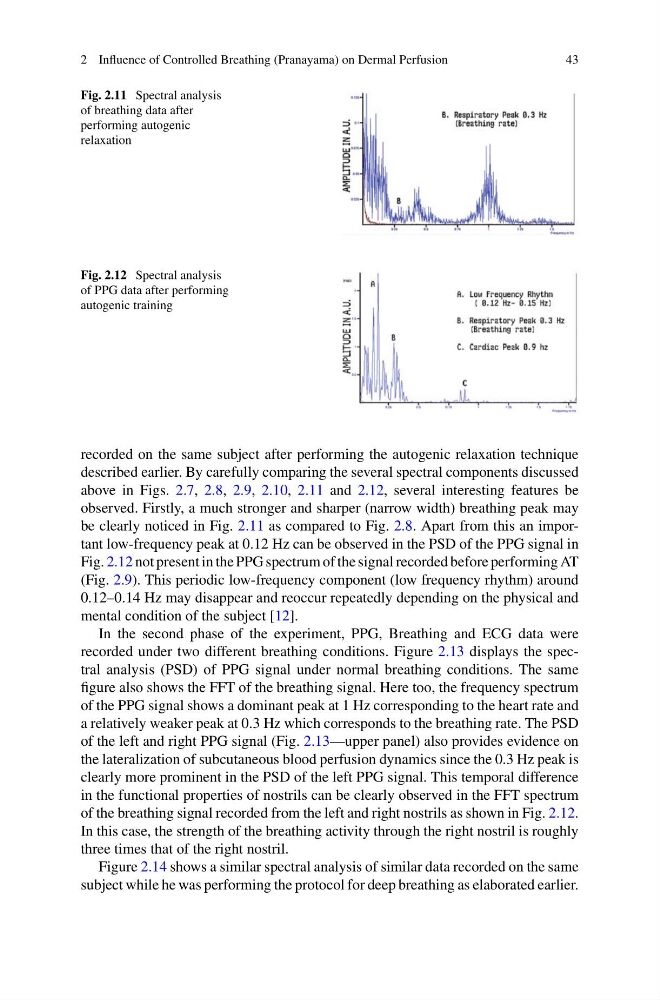
Fig. 2.11 Spectral analysis
of breathing data after
performing autogenic
relaxation
Fig. 2.12 Spectral analysis
of PPG data after performing
autogenic training
recorded on the same subject after performing the autogenic relaxation technique
described earlier. By carefully comparing the several spectral components discussed
above in Figs. 2.7, 2.8, 2.9, 2.10, 2.11 and 2.12, several interesting features be
observed. Firstly, a much stronger and sharper (narrow width) breathing peak may
be clearly noticed in Fig. 2.11 as compared to Fig. 2.8. Apart from this an important low-frequency peak at 0.12 Hz can be observed in the PSD of the PPG signal in
Fig. 2.12 not present in the PPG spectrum of the signal recorded before performing AT
(Fig. 2.9). This periodic low-frequency component (low frequency rhythm) around
0.12–0.14 Hz may disappear and reoccur repeatedly depending on the physical and
mental condition of the subject [12].
In the second phase of the experiment, PPG, Breathing and ECG data were
recorded under two different breathing conditions. Figure 2.13 displays the spectral analysis (PSD) of PPG signal under normal breathing conditions. The same
figure also shows the FFT of the breathing signal. Here too, the frequency spectrum
of the PPG signal shows a dominant peak at 1 Hz corresponding to the heart rate and
a relatively weaker peak at 0.3 Hz which corresponds to the breathing rate. The PSD
of the left and right PPG signal (Fig. 2.13—upper panel) also provides evidence on
the lateralization of subcutaneous blood perfusion dynamics since the 0.3 Hz peak is
clearly more prominent in the PSD of the left PPG signal. This temporal difference
in the functional properties of nostrils can be clearly observed in the FFT spectrum
of the breathing signal recorded from the left and right nostrils as shown in Fig. 2.12.
In this case, the strength of the breathing activity through the right nostril is roughly
three times that of the right nostril.
Figure 2.14 shows a similar spectral analysis of similar data recorded on the same
subject while he was performing the protocol for deep breathing as elaborated earlier.
43
Fig. 2.11 Spectral analysis
of breathing data after
performing autogenic
relaxation
Fig. 2.12 Spectral analysis
of PPG data after performing
autogenic training
recorded on the same subject after performing the autogenic relaxation technique
described earlier. By carefully comparing the several spectral components discussed
above in Figs. 2.7, 2.8, 2.9, 2.10, 2.11 and 2.12, several interesting features be
observed. Firstly, a much stronger and sharper (narrow width) breathing peak may
be clearly noticed in Fig. 2.11 as compared to Fig. 2.8. Apart from this an important low-frequency peak at 0.12 Hz can be observed in the PSD of the PPG signal in
Fig. 2.12 not present in the PPG spectrum of the signal recorded before performing AT
(Fig. 2.9). This periodic low-frequency component (low frequency rhythm) around
0.12–0.14 Hz may disappear and reoccur repeatedly depending on the physical and
mental condition of the subject [12].
In the second phase of the experiment, PPG, Breathing and ECG data were
recorded under two different breathing conditions. Figure 2.13 displays the spectral analysis (PSD) of PPG signal under normal breathing conditions. The same
figure also shows the FFT of the breathing signal. Here too, the frequency spectrum
of the PPG signal shows a dominant peak at 1 Hz corresponding to the heart rate and
a relatively weaker peak at 0.3 Hz which corresponds to the breathing rate. The PSD
of the left and right PPG signal (Fig. 2.13—upper panel) also provides evidence on
the lateralization of subcutaneous blood perfusion dynamics since the 0.3 Hz peak is
clearly more prominent in the PSD of the left PPG signal. This temporal difference
in the functional properties of nostrils can be clearly observed in the FFT spectrum
of the breathing signal recorded from the left and right nostrils as shown in Fig. 2.12.
In this case, the strength of the breathing activity through the right nostril is roughly
three times that of the right nostril.
Figure 2.14 shows a similar spectral analysis of similar data recorded on the same
subject while he was performing the protocol for deep breathing as elaborated earlier.