

42
M. Mukunda Rao
Fig. 2.8 Spectral analysis of
breathing data before
performing autogenic
training (AT)
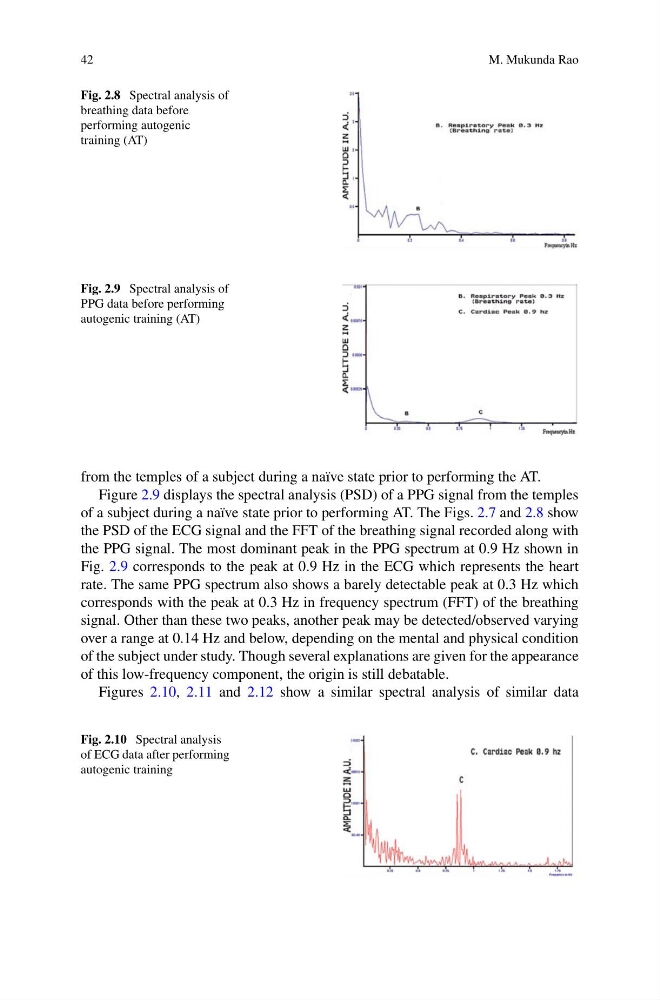
Fig. 2.9 Spectral analysis of
PPG data before performing
autogenic training (AT)
from the temples of a subject during a naïve state prior to performing the AT.
Figure 2.9 displays the spectral analysis (PSD) of a PPG signal from the temples
of a subject during a naïve state prior to performing AT. The Figs. 2.7 and 2.8 show
the PSD of the ECG signal and the FFT of the breathing signal recorded along with
the PPG signal. The most dominant peak in the PPG spectrum at 0.9 Hz shown in
Fig. 2.9 corresponds to the peak at 0.9 Hz in the ECG which represents the heart
rate. The same PPG spectrum also shows a barely detectable peak at 0.3 Hz which
corresponds with the peak at 0.3 Hz in frequency spectrum (FFT) of the breathing
signal. Other than these two peaks, another peak may be detected/observed varying
over a range at 0.14 Hz and below, depending on the mental and physical condition
of the subject under study. Though several explanations are given for the appearance
of this low-frequency component, the origin is still debatable.
Figures 2.10, 2.11 and 2.12 show a similar spectral analysis of similar data
Fig. 2.10 Spectral analysis
of ECG data after performing
autogenic training
M. Mukunda Rao
Fig. 2.8 Spectral analysis of
breathing data before
performing autogenic
training (AT)
Fig. 2.9 Spectral analysis of
PPG data before performing
autogenic training (AT)
from the temples of a subject during a naïve state prior to performing the AT.
Figure 2.9 displays the spectral analysis (PSD) of a PPG signal from the temples
of a subject during a naïve state prior to performing AT. The Figs. 2.7 and 2.8 show
the PSD of the ECG signal and the FFT of the breathing signal recorded along with
the PPG signal. The most dominant peak in the PPG spectrum at 0.9 Hz shown in
Fig. 2.9 corresponds to the peak at 0.9 Hz in the ECG which represents the heart
rate. The same PPG spectrum also shows a barely detectable peak at 0.3 Hz which
corresponds with the peak at 0.3 Hz in frequency spectrum (FFT) of the breathing
signal. Other than these two peaks, another peak may be detected/observed varying
over a range at 0.14 Hz and below, depending on the mental and physical condition
of the subject under study. Though several explanations are given for the appearance
of this low-frequency component, the origin is still debatable.
Figures 2.10, 2.11 and 2.12 show a similar spectral analysis of similar data
Fig. 2.10 Spectral analysis
of ECG data after performing
autogenic training