

14
V. Blazek
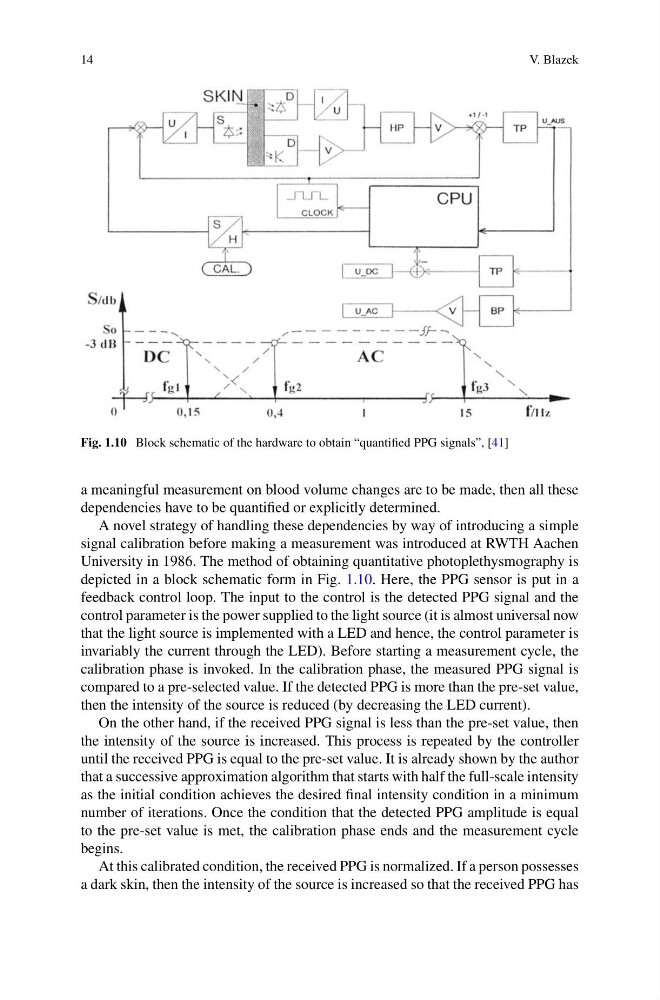
Fig. 1.10 Block schematic of the hardware to obtain “quantified PPG signals”, [41]
a meaningful measurement on blood volume changes are to be made, then all these
dependencies have to be quantified or explicitly determined.
A novel strategy of handling these dependencies by way of introducing a simple
signal calibration before making a measurement was introduced at RWTH Aachen
University in 1986. The method of obtaining quantitative photoplethysmography is
depicted in a block schematic form in Fig. 1.10. Here, the PPG sensor is put in a
feedback control loop. The input to the control is the detected PPG signal and the
control parameter is the power supplied to the light source (it is almost universal now
that the light source is implemented with a LED and hence, the control parameter is
invariably the current through the LED). Before starting a measurement cycle, the
calibration phase is invoked. In the calibration phase, the measured PPG signal is
compared to a pre-selected value. If the detected PPG is more than the pre-set value,
then the intensity of the source is reduced (by decreasing the LED current).
On the other hand, if the received PPG signal is less than the pre-set value, then
the intensity of the source is increased. This process is repeated by the controller
until the received PPG is equal to the pre-set value. It is already shown by the author
that a successive approximation algorithm that starts with half the full-scale intensity
as the initial condition achieves the desired final intensity condition in a minimum
number of iterations. Once the condition that the detected PPG amplitude is equal
to the pre-set value is met, the calibration phase ends and the measurement cycle
begins.
At this calibrated condition, the received PPG is normalized. If a person possesses
a dark skin, then the intensity of the source is increased so that the received PPG has
V. Blazek
Fig. 1.10 Block schematic of the hardware to obtain “quantified PPG signals”, [41]
a meaningful measurement on blood volume changes are to be made, then all these
dependencies have to be quantified or explicitly determined.
A novel strategy of handling these dependencies by way of introducing a simple
signal calibration before making a measurement was introduced at RWTH Aachen
University in 1986. The method of obtaining quantitative photoplethysmography is
depicted in a block schematic form in Fig. 1.10. Here, the PPG sensor is put in a
feedback control loop. The input to the control is the detected PPG signal and the
control parameter is the power supplied to the light source (it is almost universal now
that the light source is implemented with a LED and hence, the control parameter is
invariably the current through the LED). Before starting a measurement cycle, the
calibration phase is invoked. In the calibration phase, the measured PPG signal is
compared to a pre-selected value. If the detected PPG is more than the pre-set value,
then the intensity of the source is reduced (by decreasing the LED current).
On the other hand, if the received PPG signal is less than the pre-set value, then
the intensity of the source is increased. This process is repeated by the controller
until the received PPG is equal to the pre-set value. It is already shown by the author
that a successive approximation algorithm that starts with half the full-scale intensity
as the initial condition achieves the desired final intensity condition in a minimum
number of iterations. Once the condition that the detected PPG amplitude is equal
to the pre-set value is met, the calibration phase ends and the measurement cycle
begins.
At this calibrated condition, the received PPG is normalized. If a person possesses
a dark skin, then the intensity of the source is increased so that the received PPG has