

218
C. Blazek and V. Blazek
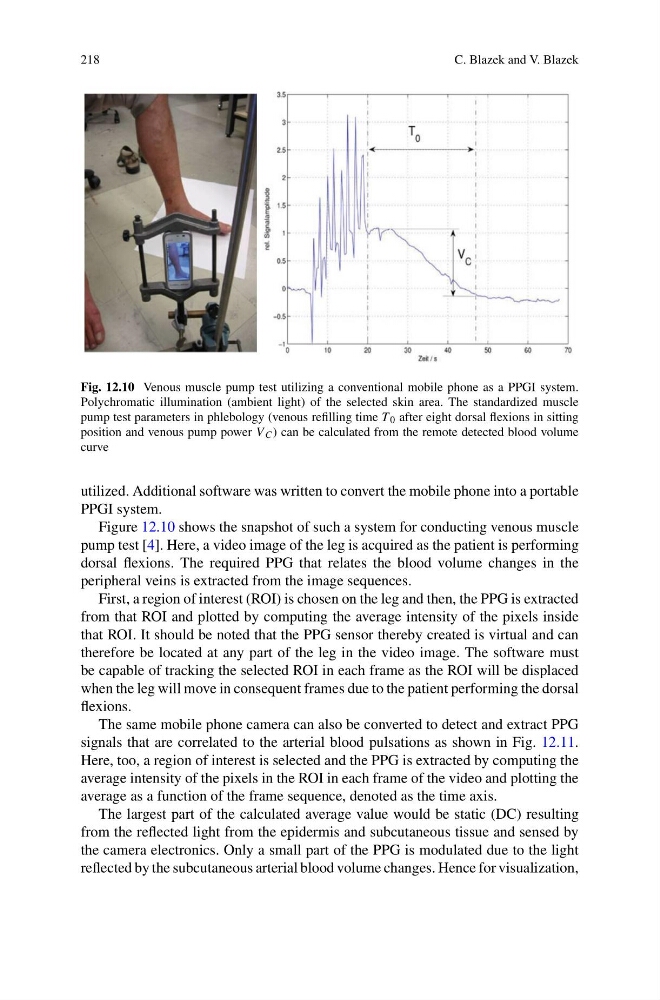
Fig. 12.10 Venous muscle pump test utilizing a conventional mobile phone as a PPGI system.
Polychromatic illumination (ambient light) of the selected skin area. The standardized muscle
pump test parameters in phlebology (venous refilling time T 0 after eight dorsal flexions in sitting
position and venous pump power V C ) can be calculated from the remote detected blood volume
curve
utilized. Additional software was written to convert the mobile phone into a portable
PPGI system.
Figure 12.10 shows the snapshot of such a system for conducting venous muscle
pump test [4]. Here, a video image of the leg is acquired as the patient is performing
dorsal flexions. The required PPG that relates the blood volume changes in the
peripheral veins is extracted from the image sequences.
First, a region of interest (ROI) is chosen on the leg and then, the PPG is extracted
from that ROI and plotted by computing the average intensity of the pixels inside
that ROI. It should be noted that the PPG sensor thereby created is virtual and can
therefore be located at any part of the leg in the video image. The software must
be capable of tracking the selected ROI in each frame as the ROI will be displaced
when the leg will move in consequent frames due to the patient performing the dorsal
flexions.
The same mobile phone camera can also be converted to detect and extract PPG
signals that are correlated to the arterial blood pulsations as shown in Fig. 12.11.
Here, too, a region of interest is selected and the PPG is extracted by computing the
average intensity of the pixels in the ROI in each frame of the video and plotting the
average as a function of the frame sequence, denoted as the time axis.
The largest part of the calculated average value would be static (DC) resulting
from the reflected light from the epidermis and subcutaneous tissue and sensed by
the camera electronics. Only a small part of the PPG is modulated due to the light
reflected by the subcutaneous arterial blood volume changes. Hence for visualization,
C. Blazek and V. Blazek
Fig. 12.10 Venous muscle pump test utilizing a conventional mobile phone as a PPGI system.
Polychromatic illumination (ambient light) of the selected skin area. The standardized muscle
pump test parameters in phlebology (venous refilling time T 0 after eight dorsal flexions in sitting
position and venous pump power V C ) can be calculated from the remote detected blood volume
curve
utilized. Additional software was written to convert the mobile phone into a portable
PPGI system.
Figure 12.10 shows the snapshot of such a system for conducting venous muscle
pump test [4]. Here, a video image of the leg is acquired as the patient is performing
dorsal flexions. The required PPG that relates the blood volume changes in the
peripheral veins is extracted from the image sequences.
First, a region of interest (ROI) is chosen on the leg and then, the PPG is extracted
from that ROI and plotted by computing the average intensity of the pixels inside
that ROI. It should be noted that the PPG sensor thereby created is virtual and can
therefore be located at any part of the leg in the video image. The software must
be capable of tracking the selected ROI in each frame as the ROI will be displaced
when the leg will move in consequent frames due to the patient performing the dorsal
flexions.
The same mobile phone camera can also be converted to detect and extract PPG
signals that are correlated to the arterial blood pulsations as shown in Fig. 12.11.
Here, too, a region of interest is selected and the PPG is extracted by computing the
average intensity of the pixels in the ROI in each frame of the video and plotting the
average as a function of the frame sequence, denoted as the time axis.
The largest part of the calculated average value would be static (DC) resulting
from the reflected light from the epidermis and subcutaneous tissue and sensed by
the camera electronics. Only a small part of the PPG is modulated due to the light
reflected by the subcutaneous arterial blood volume changes. Hence for visualization,