

216
C. Blazek and V. Blazek
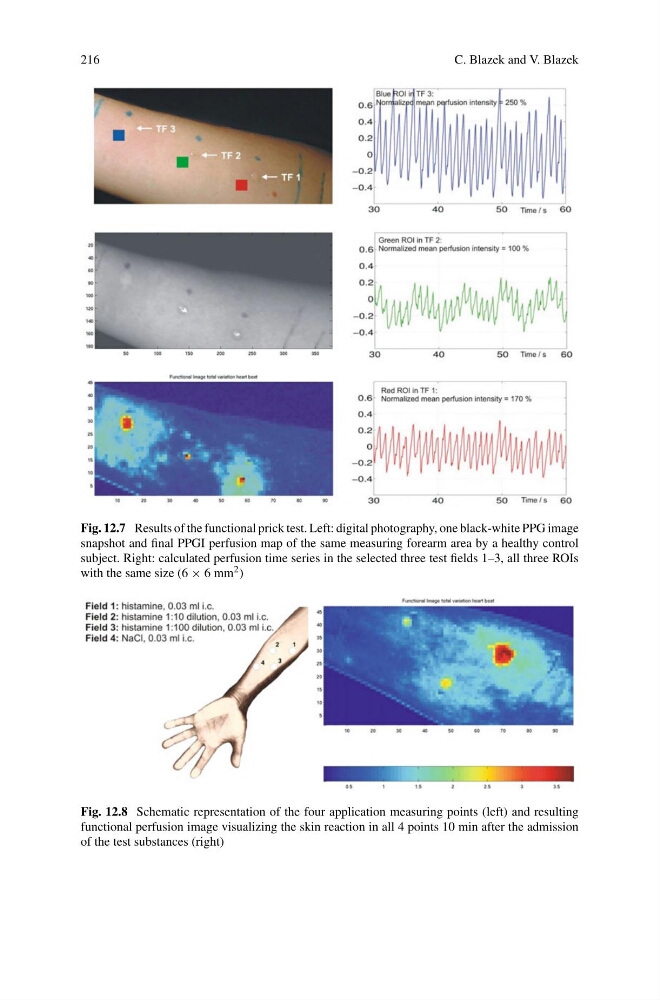
Fig. 12.7 Results of the functional prick test. Left: digital photography, one black-white PPG image
snapshot and final PPGI perfusion map of the same measuring forearm area by a healthy control
subject. Right: calculated perfusion time series in the selected three test fields 1–3, all three ROIs
with the same size (6 × 6 mm 2 )
Fig. 12.8 Schematic representation of the four application measuring points (left) and resulting
functional perfusion image visualizing the skin reaction in all 4 points 10 min after the admission
of the test substances (right)
C. Blazek and V. Blazek
Fig. 12.7 Results of the functional prick test. Left: digital photography, one black-white PPG image
snapshot and final PPGI perfusion map of the same measuring forearm area by a healthy control
subject. Right: calculated perfusion time series in the selected three test fields 1–3, all three ROIs
with the same size (6 × 6 mm 2 )
Fig. 12.8 Schematic representation of the four application measuring points (left) and resulting
functional perfusion image visualizing the skin reaction in all 4 points 10 min after the admission
of the test substances (right)