

11 Remote Space- and Time-Resolved Skin Perfusion Detection …
189
A visual analysis of a raw PPGI-time-signal makes possible the recognition of the
typical waveform of a PPG heartbeat signal (see Fig. 11.10 (left)). Digital filters can
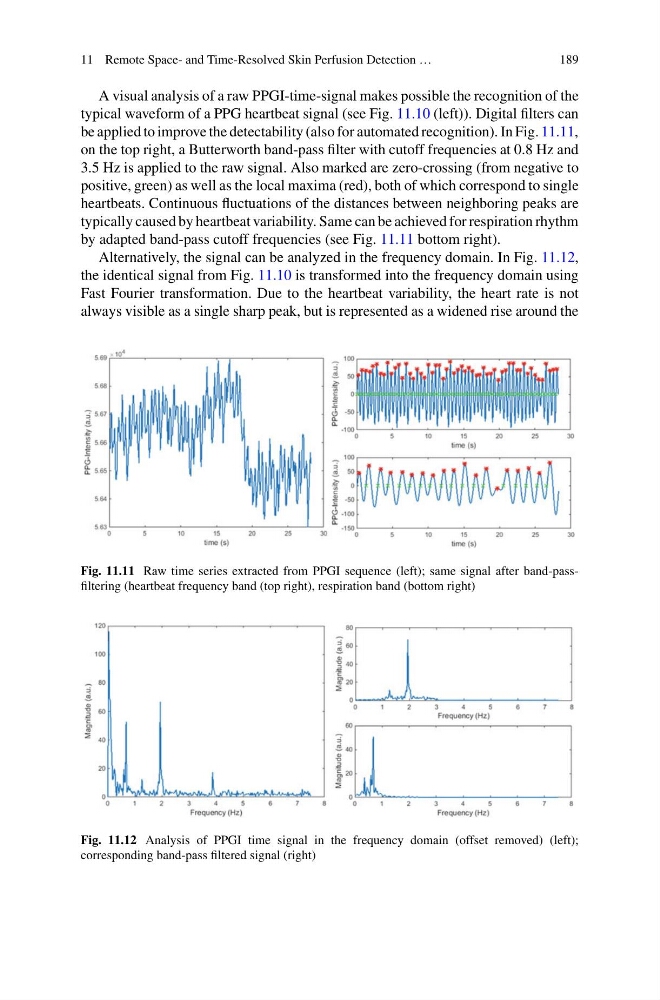
be applied to improve the detectability (also for automated recognition). In Fig. 11.11,
on the top right, a Butterworth band-pass filter with cutoff frequencies at 0.8 Hz and
3.5 Hz is applied to the raw signal. Also marked are zero-crossing (from negative to
positive, green) as well as the local maxima (red), both of which correspond to single
heartbeats. Continuous fluctuations of the distances between neighboring peaks are
typically caused by heartbeat variability. Same can be achieved for respiration rhythm
by adapted band-pass cutoff frequencies (see Fig. 11.11 bottom right).
Alternatively, the signal can be analyzed in the frequency domain. In Fig. 11.12,
the identical signal from Fig. 11.10 is transformed into the frequency domain using
Fast Fourier transformation. Due to the heartbeat variability, the heart rate is not
always visible as a single sharp peak, but is represented as a widened rise around the
Fig. 11.11 Raw time series extracted from PPGI sequence (left); same signal after band-passfiltering (heartbeat frequency band (top right), respiration band (bottom right)
Fig. 11.12 Analysis of PPGI time signal in the frequency domain (offset removed) (left);
corresponding band-pass filtered signal (right)
189
A visual analysis of a raw PPGI-time-signal makes possible the recognition of the
typical waveform of a PPG heartbeat signal (see Fig. 11.10 (left)). Digital filters can
be applied to improve the detectability (also for automated recognition). In Fig. 11.11,
on the top right, a Butterworth band-pass filter with cutoff frequencies at 0.8 Hz and
3.5 Hz is applied to the raw signal. Also marked are zero-crossing (from negative to
positive, green) as well as the local maxima (red), both of which correspond to single
heartbeats. Continuous fluctuations of the distances between neighboring peaks are
typically caused by heartbeat variability. Same can be achieved for respiration rhythm
by adapted band-pass cutoff frequencies (see Fig. 11.11 bottom right).
Alternatively, the signal can be analyzed in the frequency domain. In Fig. 11.12,
the identical signal from Fig. 11.10 is transformed into the frequency domain using
Fast Fourier transformation. Due to the heartbeat variability, the heart rate is not
always visible as a single sharp peak, but is represented as a widened rise around the
Fig. 11.11 Raw time series extracted from PPGI sequence (left); same signal after band-passfiltering (heartbeat frequency band (top right), respiration band (bottom right)
Fig. 11.12 Analysis of PPGI time signal in the frequency domain (offset removed) (left);
corresponding band-pass filtered signal (right)