

188
N. Blanik
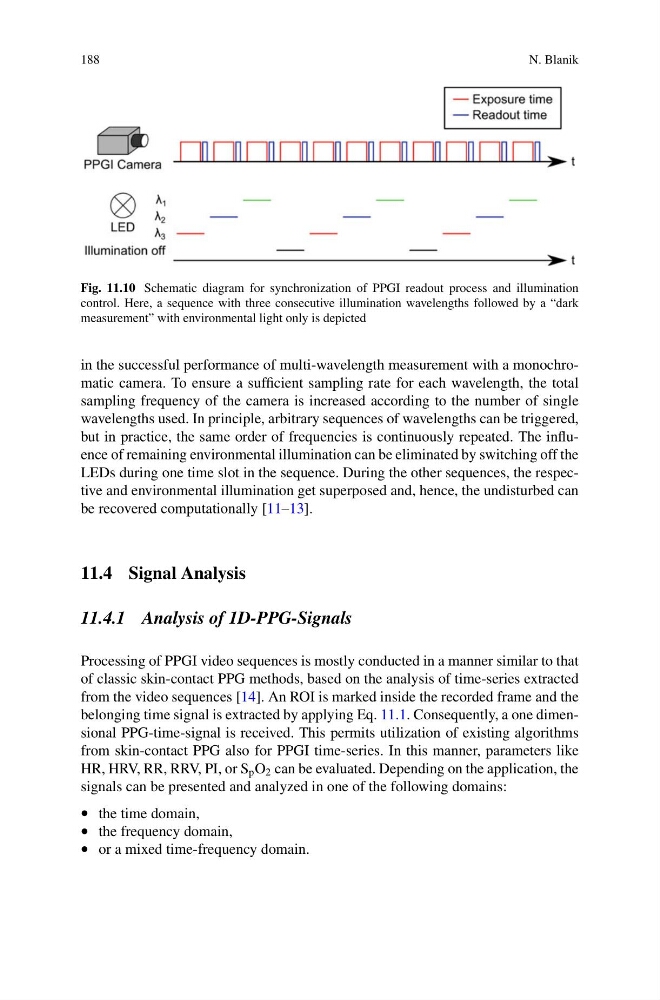
Fig. 11.10 Schematic diagram for synchronization of PPGI readout process and illumination
control. Here, a sequence with three consecutive illumination wavelengths followed by a “dark
measurement” with environmental light only is depicted
in the successful performance of multi-wavelength measurement with a monochromatic camera. To ensure a sufficient sampling rate for each wavelength, the total
sampling frequency of the camera is increased according to the number of single
wavelengths used. In principle, arbitrary sequences of wavelengths can be triggered,
but in practice, the same order of frequencies is continuously repeated. The influence of remaining environmental illumination can be eliminated by switching off the
LEDs during one time slot in the sequence. During the other sequences, the respective and environmental illumination get superposed and, hence, the undisturbed can
be recovered computationally [11–13].
11.4 Signal Analysis
11.4.1 Analysis of 1D-PPG-Signals
Processing of PPGI video sequences is mostly conducted in a manner similar to that
of classic skin-contact PPG methods, based on the analysis of time-series extracted
from the video sequences [14]. An ROI is marked inside the recorded frame and the
belonging time signal is extracted by applying Eq. 11.1. Consequently, a one dimensional PPG-time-signal is received. This permits utilization of existing algorithms
from skin-contact PPG also for PPGI time-series. In this manner, parameters like
HR, HRV, RR, RRV, PI, or S p O 2 can be evaluated. Depending on the application, the
signals can be presented and analyzed in one of the following domains:
• the time domain,
• the frequency domain,
• or a mixed time-frequency domain.
N. Blanik
Fig. 11.10 Schematic diagram for synchronization of PPGI readout process and illumination
control. Here, a sequence with three consecutive illumination wavelengths followed by a “dark
measurement” with environmental light only is depicted
in the successful performance of multi-wavelength measurement with a monochromatic camera. To ensure a sufficient sampling rate for each wavelength, the total
sampling frequency of the camera is increased according to the number of single
wavelengths used. In principle, arbitrary sequences of wavelengths can be triggered,
but in practice, the same order of frequencies is continuously repeated. The influence of remaining environmental illumination can be eliminated by switching off the
LEDs during one time slot in the sequence. During the other sequences, the respective and environmental illumination get superposed and, hence, the undisturbed can
be recovered computationally [11–13].
11.4 Signal Analysis
11.4.1 Analysis of 1D-PPG-Signals
Processing of PPGI video sequences is mostly conducted in a manner similar to that
of classic skin-contact PPG methods, based on the analysis of time-series extracted
from the video sequences [14]. An ROI is marked inside the recorded frame and the
belonging time signal is extracted by applying Eq. 11.1. Consequently, a one dimensional PPG-time-signal is received. This permits utilization of existing algorithms
from skin-contact PPG also for PPGI time-series. In this manner, parameters like
HR, HRV, RR, RRV, PI, or S p O 2 can be evaluated. Depending on the application, the
signals can be presented and analyzed in one of the following domains:
• the time domain,
• the frequency domain,
• or a mixed time-frequency domain.