

170
M. Hülsbusch and V. Blazek
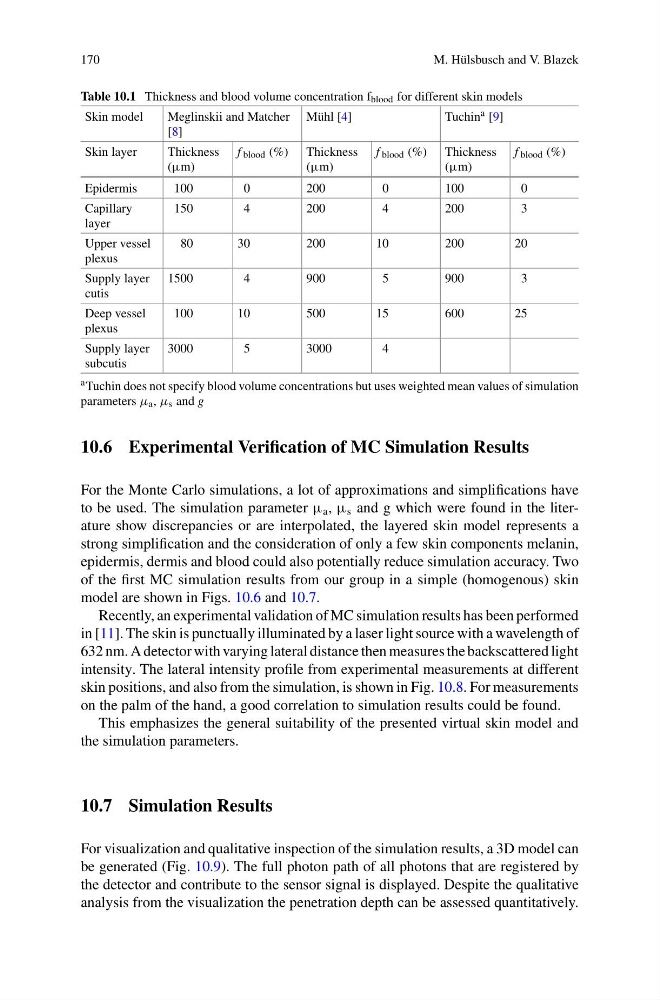
Table 10.1 Thickness and blood volume concentration f blood for different skin models
Skin model
Meglinskii and Matcher
[8]
Mühl [4]
Tuchin a [9]
Skin layer
Thickness
(μm)
f blood (%) Thickness
(μm)
f blood (%) Thickness
(μm)
f blood (%)
Epidermis
100
0
200
0
100
0
Capillary
layer
150
4
200
4
200
3
Upper vessel
plexus
80
30
200
10
200
20
Supply layer
cutis
1500
4
900
5
900
3
Deep vessel
plexus
100
10
500
15
600
25
Supply layer
subcutis
3000
5
3000
4
a Tuchin does not specify blood volume concentrations but uses weighted mean values of simulation
parameters μ a , μ s and g
10.6 Experimental Verification of MC Simulation Results
For the Monte Carlo simulations, a lot of approximations and simplifications have
to be used. The simulation parameter μ a , μ s and g which were found in the literature show discrepancies or are interpolated, the layered skin model represents a
strong simplification and the consideration of only a few skin components melanin,
epidermis, dermis and blood could also potentially reduce simulation accuracy. Two
of the first MC simulation results from our group in a simple (homogenous) skin
model are shown in Figs. 10.6 and 10.7.
Recently, an experimental validation of MC simulation results has been performed
in [11]. The skin is punctually illuminated by a laser light source with a wavelength of
632 nm. A detector with varying lateral distance then measures the backscattered light
intensity. The lateral intensity profile from experimental measurements at different
skin positions, and also from the simulation, is shown in Fig. 10.8. For measurements
on the palm of the hand, a good correlation to simulation results could be found.
This emphasizes the general suitability of the presented virtual skin model and
the simulation parameters.
10.7 Simulation Results
For visualization and qualitative inspection of the simulation results, a 3D model can
be generated (Fig. 10.9). The full photon path of all photons that are registered by
the detector and contribute to the sensor signal is displayed. Despite the qualitative
analysis from the visualization the penetration depth can be assessed quantitatively.
M. Hülsbusch and V. Blazek
Table 10.1 Thickness and blood volume concentration f blood for different skin models
Skin model
Meglinskii and Matcher
[8]
Mühl [4]
Tuchin a [9]
Skin layer
Thickness
(μm)
f blood (%) Thickness
(μm)
f blood (%) Thickness
(μm)
f blood (%)
Epidermis
100
0
200
0
100
0
Capillary
layer
150
4
200
4
200
3
Upper vessel
plexus
80
30
200
10
200
20
Supply layer
cutis
1500
4
900
5
900
3
Deep vessel
plexus
100
10
500
15
600
25
Supply layer
subcutis
3000
5
3000
4
a Tuchin does not specify blood volume concentrations but uses weighted mean values of simulation
parameters μ a , μ s and g
10.6 Experimental Verification of MC Simulation Results
For the Monte Carlo simulations, a lot of approximations and simplifications have
to be used. The simulation parameter μ a , μ s and g which were found in the literature show discrepancies or are interpolated, the layered skin model represents a
strong simplification and the consideration of only a few skin components melanin,
epidermis, dermis and blood could also potentially reduce simulation accuracy. Two
of the first MC simulation results from our group in a simple (homogenous) skin
model are shown in Figs. 10.6 and 10.7.
Recently, an experimental validation of MC simulation results has been performed
in [11]. The skin is punctually illuminated by a laser light source with a wavelength of
632 nm. A detector with varying lateral distance then measures the backscattered light
intensity. The lateral intensity profile from experimental measurements at different
skin positions, and also from the simulation, is shown in Fig. 10.8. For measurements
on the palm of the hand, a good correlation to simulation results could be found.
This emphasizes the general suitability of the presented virtual skin model and
the simulation parameters.
10.7 Simulation Results
For visualization and qualitative inspection of the simulation results, a 3D model can
be generated (Fig. 10.9). The full photon path of all photons that are registered by
the detector and contribute to the sensor signal is displayed. Despite the qualitative
analysis from the visualization the penetration depth can be assessed quantitatively.