

88
B. Venema
signal processing of different devices or bilateral differences between the right and
left ear, could be excluded.
In any case, the distance between the regression lines is almost constant over the
entire SaO 2 range. The mean steepness dSpO 2 /dR of all regression lines between 70100% is almost constant (mean −99.78, standard deviation 12). Therefore, an absolute SpO 2 measurement can be performed with a single-point calibration routine. For
this, the current oxygen saturation must be identified at the beginning of measurement (i.e. with a conventional finger pulse oximeter). R offset is defined as the distance
of the R-value to 0.7 at normal saturation (98–100%) for each participant k:
R offset (k) = 0.7 − R norm (k)
(4.3)
By means of R offset the systematic measurement difference can be compensated
for the entire measurement range.
R comp (i, k) = R(i, k) + R offset (k)
(4.4)
The resulting parameter identification provides the global calibration instruction
SpO 2 = 176.64 · R
2
−122.64 · R + 14.78.
(4.5)
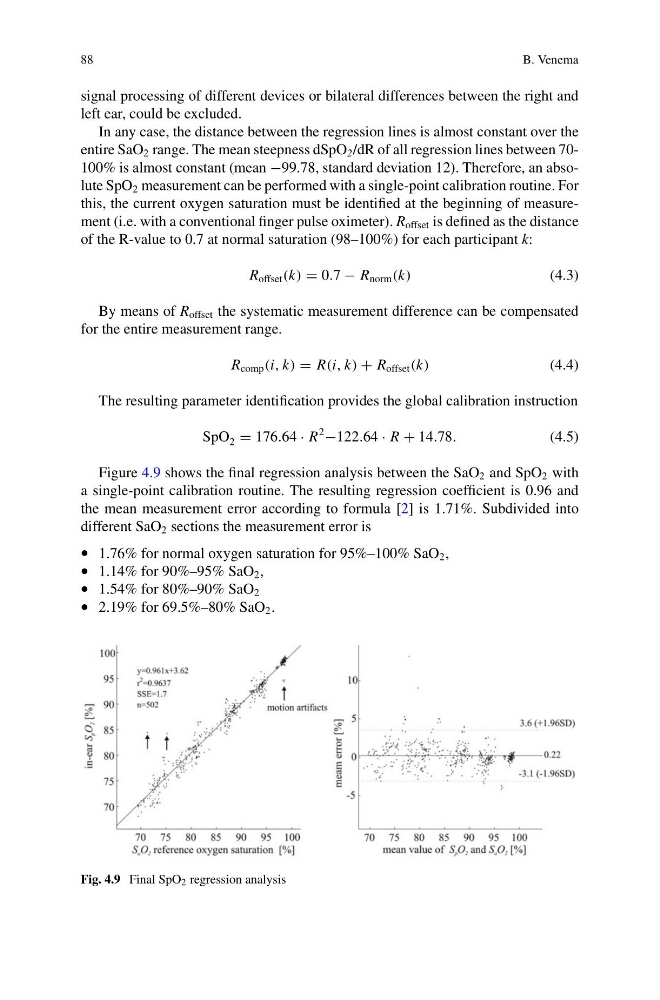
Figure 4.9 shows the final regression analysis between the SaO 2 and SpO 2 with
a single-point calibration routine. The resulting regression coefficient is 0.96 and
the mean measurement error according to formula [2] is 1.71%. Subdivided into
different SaO 2 sections the measurement error is
• 1.76% for normal oxygen saturation for 95%–100% SaO 2 ,
• 1.14% for 90%–95% SaO 2 ,
• 1.54% for 80%–90% SaO 2
• 2.19% for 69.5%–80% SaO 2 .
Fig. 4.9 Final SpO 2 regression analysis
B. Venema
signal processing of different devices or bilateral differences between the right and
left ear, could be excluded.
In any case, the distance between the regression lines is almost constant over the
entire SaO 2 range. The mean steepness dSpO 2 /dR of all regression lines between 70100% is almost constant (mean −99.78, standard deviation 12). Therefore, an absolute SpO 2 measurement can be performed with a single-point calibration routine. For
this, the current oxygen saturation must be identified at the beginning of measurement (i.e. with a conventional finger pulse oximeter). R offset is defined as the distance
of the R-value to 0.7 at normal saturation (98–100%) for each participant k:
R offset (k) = 0.7 − R norm (k)
(4.3)
By means of R offset the systematic measurement difference can be compensated
for the entire measurement range.
R comp (i, k) = R(i, k) + R offset (k)
(4.4)
The resulting parameter identification provides the global calibration instruction
SpO 2 = 176.64 · R
2
−122.64 · R + 14.78.
(4.5)
Figure 4.9 shows the final regression analysis between the SaO 2 and SpO 2 with
a single-point calibration routine. The resulting regression coefficient is 0.96 and
the mean measurement error according to formula [2] is 1.71%. Subdivided into
different SaO 2 sections the measurement error is
• 1.76% for normal oxygen saturation for 95%–100% SaO 2 ,
• 1.14% for 90%–95% SaO 2 ,
• 1.54% for 80%–90% SaO 2
• 2.19% for 69.5%–80% SaO 2 .
Fig. 4.9 Final SpO 2 regression analysis