

4 Reflective Arterial Pulse Oximetry for New Measuring Sites …
87
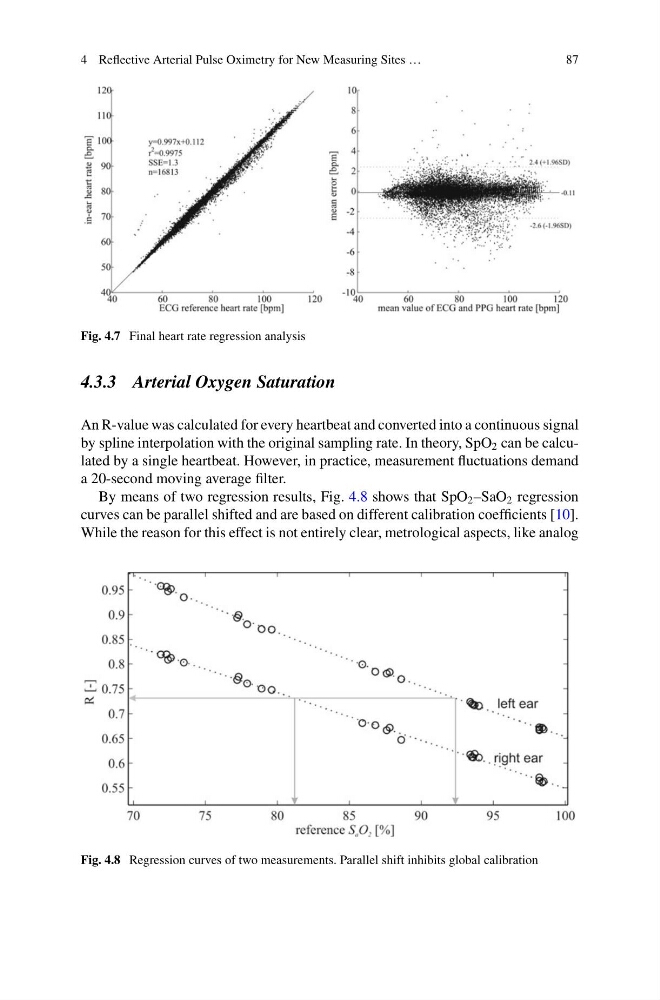
Fig. 4.7 Final heart rate regression analysis
4.3.3 Arterial Oxygen Saturation
An R-value was calculated for every heartbeat and converted into a continuous signal
by spline interpolation with the original sampling rate. In theory, SpO 2 can be calculated by a single heartbeat. However, in practice, measurement fluctuations demand
a 20-second moving average filter.
By means of two regression results, Fig. 4.8 shows that SpO 2 –SaO 2 regression
curves can be parallel shifted and are based on different calibration coefficients [10].
While the reason for this effect is not entirely clear, metrological aspects, like analog
Fig. 4.8 Regression curves of two measurements. Parallel shift inhibits global calibration
87
Fig. 4.7 Final heart rate regression analysis
4.3.3 Arterial Oxygen Saturation
An R-value was calculated for every heartbeat and converted into a continuous signal
by spline interpolation with the original sampling rate. In theory, SpO 2 can be calculated by a single heartbeat. However, in practice, measurement fluctuations demand
a 20-second moving average filter.
By means of two regression results, Fig. 4.8 shows that SpO 2 –SaO 2 regression
curves can be parallel shifted and are based on different calibration coefficients [10].
While the reason for this effect is not entirely clear, metrological aspects, like analog
Fig. 4.8 Regression curves of two measurements. Parallel shift inhibits global calibration