

86
B. Venema
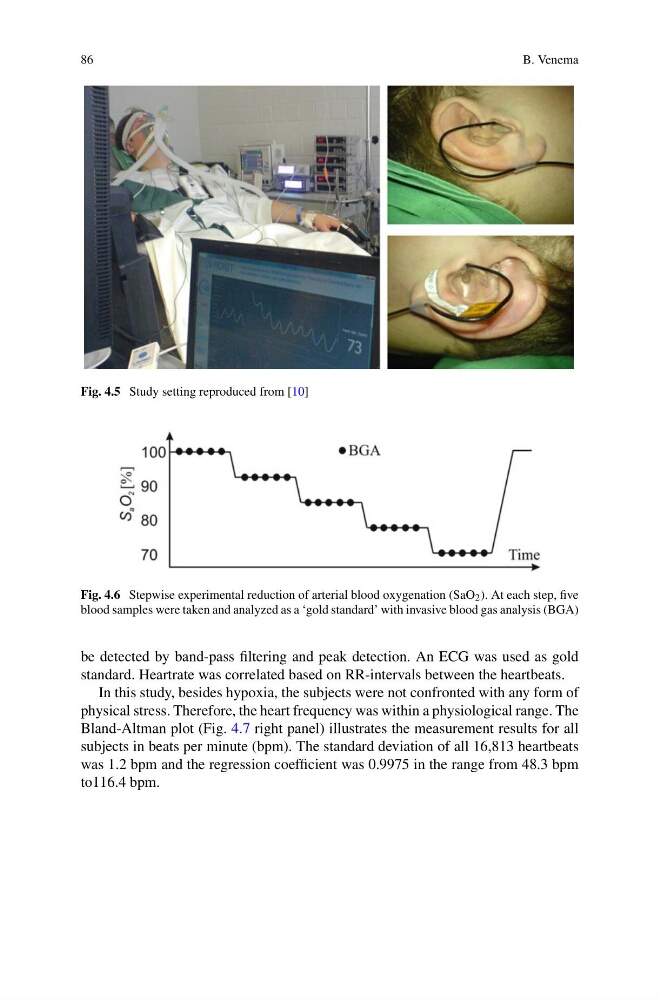
Fig. 4.5 Study setting reproduced from [10]
Fig. 4.6 Stepwise experimental reduction of arterial blood oxygenation (SaO 2 ). At each step, five
blood samples were taken and analyzed as a ‘gold standard’ with invasive blood gas analysis (BGA)
be detected by band-pass filtering and peak detection. An ECG was used as gold
standard. Heartrate was correlated based on RR-intervals between the heartbeats.
In this study, besides hypoxia, the subjects were not confronted with any form of
physical stress. Therefore, the heart frequency was within a physiological range. The
Bland-Altman plot (Fig. 4.7 right panel) illustrates the measurement results for all
subjects in beats per minute (bpm). The standard deviation of all 16,813 heartbeats
was 1.2 bpm and the regression coefficient was 0.9975 in the range from 48.3 bpm
to116.4 bpm.
B. Venema
Fig. 4.5 Study setting reproduced from [10]
Fig. 4.6 Stepwise experimental reduction of arterial blood oxygenation (SaO 2 ). At each step, five
blood samples were taken and analyzed as a ‘gold standard’ with invasive blood gas analysis (BGA)
be detected by band-pass filtering and peak detection. An ECG was used as gold
standard. Heartrate was correlated based on RR-intervals between the heartbeats.
In this study, besides hypoxia, the subjects were not confronted with any form of
physical stress. Therefore, the heart frequency was within a physiological range. The
Bland-Altman plot (Fig. 4.7 right panel) illustrates the measurement results for all
subjects in beats per minute (bpm). The standard deviation of all 16,813 heartbeats
was 1.2 bpm and the regression coefficient was 0.9975 in the range from 48.3 bpm
to116.4 bpm.