

100
of 1 × 10
6
cells/ml, are found to be 22.05 ± 1.92 (pmol s
−1
10
−6
cells) and 0.55 ± 0.02
(μM), respectively [78]. It should be noted that these parameters are estimated as to
mitochondrial consumption of O 2 . However, as already discussed, ECs also consume O 2 for ROS production, and the theoretical models should also take this additional O 2 consumption into account by, for example, including a linear correlation
in the O 2 consumption rate equation (Eq. (4.3)). Besides, all estimations of the V max
and K m parameters for the O 2 consumption of different cell types are carried out in
2D cultures. The literature currently lacks studies investigating whether or not,
depending on the composition of the extracellular matrix, encapsulating cells in 3D
gels changes their consumption of O 2 .
Vascular cells proliferate, die, migrate, and assemble during 3D cultivation,
which affects their spatial and temporal density and, therefore, O 2 distribution.
Models developed for 3D cultures of cardiomyocytes take into account the cellular
proliferation and changes in the dimensions of the cells during nutrient transport in
scaffolds [76, 77]. However, we need more detailed models, which consider how
capillary formation affects O 2 transport, to achieve more reliable estimations of spatial O 2 concentration. Tube formation and the networking of ECs in 3D gels have
been simulated by more complicated numerical models [47, 139], although the
effects of O 2 concentrations on tube formation dynamics still need to be
incorporated.
Dynamic and In Vivo Models
The models used for static cultures in 3D scaffolds can also be used to describe O 2
distributions in vivo when combined with a fluid perfusion model that considers the
convectional O 2 transfer to the tissues. The velocity profile of a fluid in capillaries
or in an engineered microchannel system can be calculated using the simplified
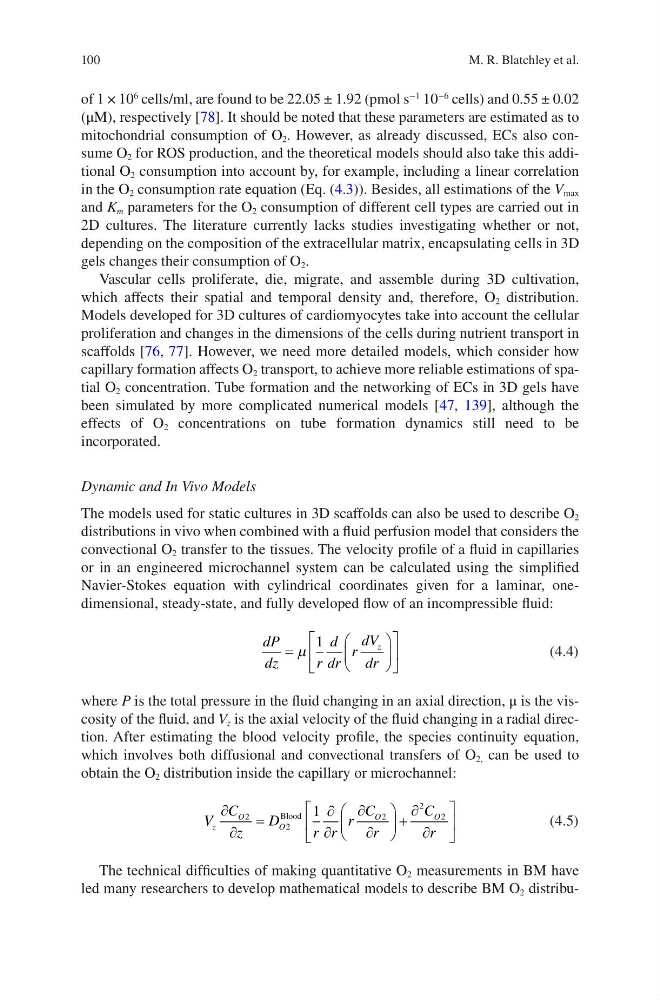
Navier-Stokes equation with cylindrical coordinates given for a laminar, onedimensional, steady-state, and fully developed flow of an incompressible fluid:
dP
dz
r
d
dr
r
dV
dr
z
=
µ
1
(4.4)
where P is the total pressure in the fluid changing in an axial direction, μ is the viscosity of the fluid, and V z is the axial velocity of the fluid changing in a radial direction. After estimating the blood velocity profile, the species continuity equation,
which involves both diffusional and convectional transfers of O 2, can be used to
obtain the O 2 distribution inside the capillary or microchannel:
V
C
z
D
r r
r
C
r
C
r
z
O
O
O
O
∂
∂
=
∂
∂
∂
∂
+
∂
∂
2
2
2
2
2
1
Blood
(4.5)
The technical difficulties of making quantitative O 2 measurements in BM have
led many researchers to develop mathematical models to describe BM O 2 distribuM. R. Blatchley et al.
of 1 × 10
6
cells/ml, are found to be 22.05 ± 1.92 (pmol s
−1
10
−6
cells) and 0.55 ± 0.02
(μM), respectively [78]. It should be noted that these parameters are estimated as to
mitochondrial consumption of O 2 . However, as already discussed, ECs also consume O 2 for ROS production, and the theoretical models should also take this additional O 2 consumption into account by, for example, including a linear correlation
in the O 2 consumption rate equation (Eq. (4.3)). Besides, all estimations of the V max
and K m parameters for the O 2 consumption of different cell types are carried out in
2D cultures. The literature currently lacks studies investigating whether or not,
depending on the composition of the extracellular matrix, encapsulating cells in 3D
gels changes their consumption of O 2 .
Vascular cells proliferate, die, migrate, and assemble during 3D cultivation,
which affects their spatial and temporal density and, therefore, O 2 distribution.
Models developed for 3D cultures of cardiomyocytes take into account the cellular
proliferation and changes in the dimensions of the cells during nutrient transport in
scaffolds [76, 77]. However, we need more detailed models, which consider how
capillary formation affects O 2 transport, to achieve more reliable estimations of spatial O 2 concentration. Tube formation and the networking of ECs in 3D gels have
been simulated by more complicated numerical models [47, 139], although the
effects of O 2 concentrations on tube formation dynamics still need to be
incorporated.
Dynamic and In Vivo Models
The models used for static cultures in 3D scaffolds can also be used to describe O 2
distributions in vivo when combined with a fluid perfusion model that considers the
convectional O 2 transfer to the tissues. The velocity profile of a fluid in capillaries
or in an engineered microchannel system can be calculated using the simplified
Navier-Stokes equation with cylindrical coordinates given for a laminar, onedimensional, steady-state, and fully developed flow of an incompressible fluid:
dP
dz
r
d
dr
r
dV
dr
z
=
µ
1
(4.4)
where P is the total pressure in the fluid changing in an axial direction, μ is the viscosity of the fluid, and V z is the axial velocity of the fluid changing in a radial direction. After estimating the blood velocity profile, the species continuity equation,
which involves both diffusional and convectional transfers of O 2, can be used to
obtain the O 2 distribution inside the capillary or microchannel:
V
C
z
D
r r
r
C
r
C
r
z
O
O
O
O
∂
∂
=
∂
∂
∂
∂
+
∂
∂
2
2
2
2
2
1
Blood
(4.5)
The technical difficulties of making quantitative O 2 measurements in BM have
led many researchers to develop mathematical models to describe BM O 2 distribuM. R. Blatchley et al.