

99
porated using perfusion systems, such as microfluidic devices, or microcirculation
in the tissues.
Static Models
In tissues cultivated under static conditions within 3D scaffolds, using different
types of biomaterials, spatial O 2 concentration can be defined with a one- dimensional
(1D), unsteady-state species continuity equation:
∂
∂
=
∂
∂
−
Co
t
Do
C o
z
R
2
2
2
2
2
(4.1)
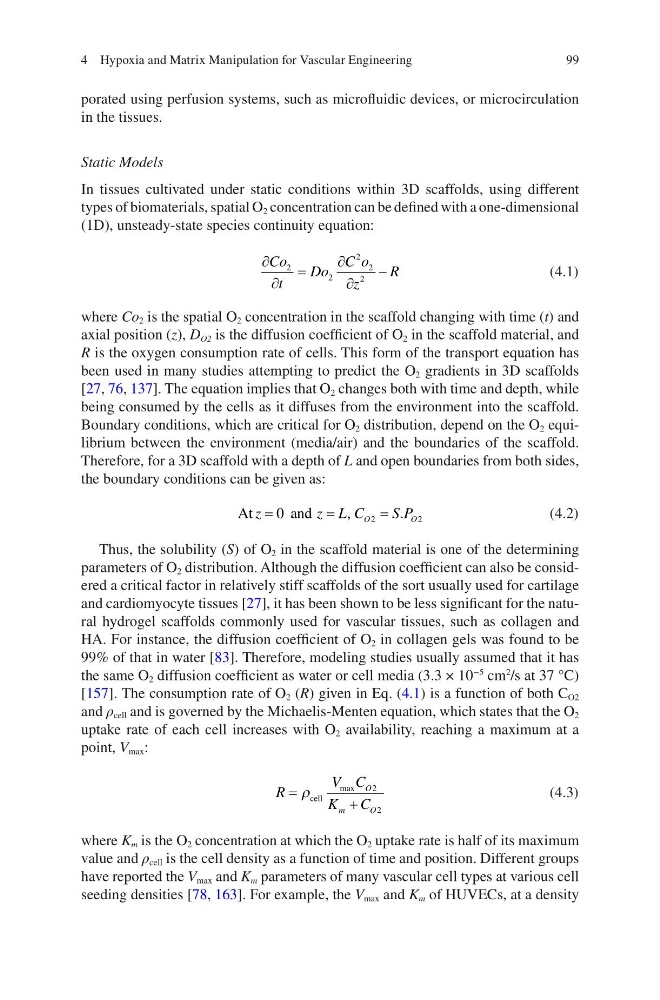
where Co 2 is the spatial O 2 concentration in the scaffold changing with time (t) and
axial position (z), D O2 is the diffusion coefficient of O 2 in the scaffold material, and
R is the oxygen consumption rate of cells. This form of the transport equation has
been used in many studies attempting to predict the O 2 gradients in 3D scaffolds
[27, 76, 137]. The equation implies that O 2 changes both with time and depth, while
being consumed by the cells as it diffuses from the environment into the scaffold.
Boundary conditions, which are critical for O 2 distribution, depend on the O 2 equilibrium between the environment (media/air) and the boundaries of the scaffold.
Therefore, for a 3D scaffold with a depth of L and open boundaries from both sides,
the boundary conditions can be given as:
At
and
z
z L C
S P
O
O
= =
=
0
2
2
,
.
(4.2)
Thus, the solubility (S) of O 2 in the scaffold material is one of the determining
parameters of O 2 distribution. Although the diffusion coefficient can also be considered a critical factor in relatively stiff scaffolds of the sort usually used for cartilage
and cardiomyocyte tissues [27], it has been shown to be less significant for the natural hydrogel scaffolds commonly used for vascular tissues, such as collagen and
HA. For instance, the diffusion coefficient of O 2 in collagen gels was found to be
99% of that in water [83]. Therefore, modeling studies usually assumed that it has
the same O 2 diffusion coefficient as water or cell media (3.3 × 10
−5
cm
2
/s at 37 °C)
[157]. The consumption rate of O 2 (R) given in Eq. (4.1) is a function of both C O2
and ρ cell and is governed by the Michaelis-Menten equation, which states that the O 2
uptake rate of each cell increases with O 2 availability, reaching a maximum at a
point, V max :
R
V C
K C
O
m
O
=
+
ρ cell
max
2
2
(4.3)
where K m is the O 2 concentration at which the O 2 uptake rate is half of its maximum
value and ρ cell is the cell density as a function of time and position. Different groups
have reported the V max and K m parameters of many vascular cell types at various cell
seeding densities [78, 163]. For example, the V max and K m of HUVECs, at a density
4 Hypoxia and Matrix Manipulation for Vascular Engineering
porated using perfusion systems, such as microfluidic devices, or microcirculation
in the tissues.
Static Models
In tissues cultivated under static conditions within 3D scaffolds, using different
types of biomaterials, spatial O 2 concentration can be defined with a one- dimensional
(1D), unsteady-state species continuity equation:
∂
∂
=
∂
∂
−
Co
t
Do
C o
z
R
2
2
2
2
2
(4.1)
where Co 2 is the spatial O 2 concentration in the scaffold changing with time (t) and
axial position (z), D O2 is the diffusion coefficient of O 2 in the scaffold material, and
R is the oxygen consumption rate of cells. This form of the transport equation has
been used in many studies attempting to predict the O 2 gradients in 3D scaffolds
[27, 76, 137]. The equation implies that O 2 changes both with time and depth, while
being consumed by the cells as it diffuses from the environment into the scaffold.
Boundary conditions, which are critical for O 2 distribution, depend on the O 2 equilibrium between the environment (media/air) and the boundaries of the scaffold.
Therefore, for a 3D scaffold with a depth of L and open boundaries from both sides,
the boundary conditions can be given as:
At
and
z
z L C
S P
O
O
= =
=
0
2
2
,
.
(4.2)
Thus, the solubility (S) of O 2 in the scaffold material is one of the determining
parameters of O 2 distribution. Although the diffusion coefficient can also be considered a critical factor in relatively stiff scaffolds of the sort usually used for cartilage
and cardiomyocyte tissues [27], it has been shown to be less significant for the natural hydrogel scaffolds commonly used for vascular tissues, such as collagen and
HA. For instance, the diffusion coefficient of O 2 in collagen gels was found to be
99% of that in water [83]. Therefore, modeling studies usually assumed that it has
the same O 2 diffusion coefficient as water or cell media (3.3 × 10
−5
cm
2
/s at 37 °C)
[157]. The consumption rate of O 2 (R) given in Eq. (4.1) is a function of both C O2
and ρ cell and is governed by the Michaelis-Menten equation, which states that the O 2
uptake rate of each cell increases with O 2 availability, reaching a maximum at a
point, V max :
R
V C
K C
O
m
O
=
+
ρ cell
max
2
2
(4.3)
where K m is the O 2 concentration at which the O 2 uptake rate is half of its maximum
value and ρ cell is the cell density as a function of time and position. Different groups
have reported the V max and K m parameters of many vascular cell types at various cell
seeding densities [78, 163]. For example, the V max and K m of HUVECs, at a density
4 Hypoxia and Matrix Manipulation for Vascular Engineering