

where the macromolecular crowding is very high, and lack of compartmentalization
renders the cell density very similar in most parts of the cell, the eukaryotic cell
organelles and compartments have dramatically different mass densities, allowing
for highly detailed visualization of lipid droplets, mitochondria, endoplasmic
reticulum (ER), actin filaments, microtubules and other cellular components [94].
Examples in Fig. 2.9 depict areas from CSTET reconstructions of breast epithelial
and lung fibroblast cells. The resolution in these tomograms is sufficient to observe
the mitochondrial cristae. Details of data collection are provided in Sect. 2.5. The DF
reconstructions (Fig. 2.9b, d) highlight the areas enriched in higher Z elements, such
as ribosomes (labeled “rib”). Deposits displaying strong contrast within the mitochondrial matrices of the fibroblast cells were analyzed by EDS and found to contain
Ca and P atoms (labeled “CaP” in panels a, b). Such deposits are not present in the
mitochondria of the breast epithelial cell shown here. Unlike most other cellular
features whose contrast inverts from BF to DF, lipid droplets (“ld” in panels c, d)
appear darker in both images. The high lipid density creates a strong BF signal, but
the high concentration of carbon, as opposed to oxygen in the aqueous background,
results in weaker scattering to high angles and a low contrast in the DF. Even such a
small difference in atomic number has a strong effect on the contrast.
2
4 4 4
3
1
2
1
4 4
3
(a)
(b)
(c)
(d)
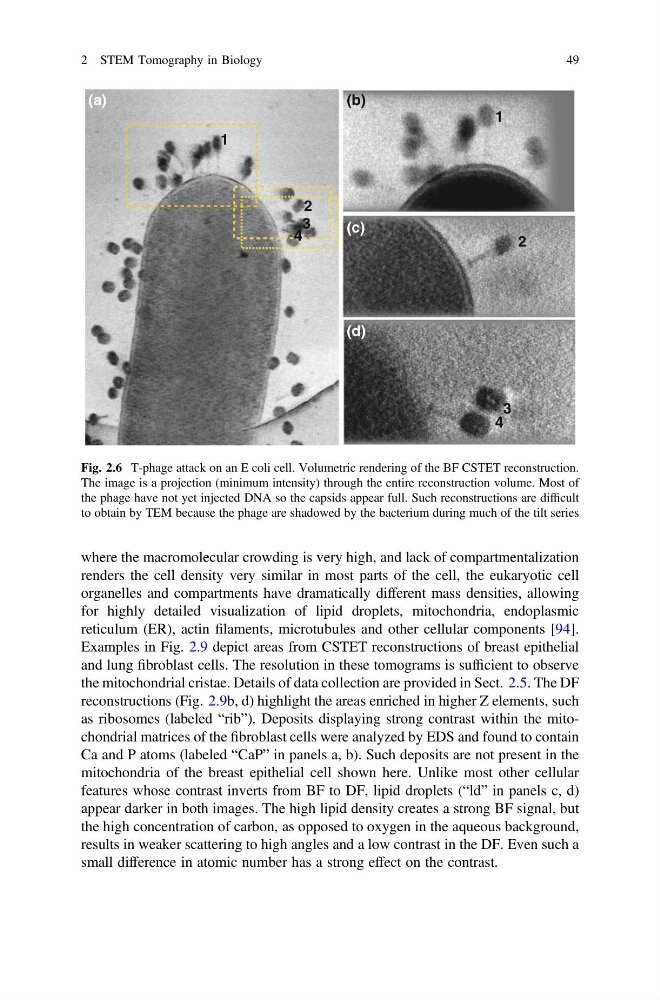
Fig. 2.6 T-phage attack on an E coli cell. Volumetric rendering of the BF CSTET reconstruction.
The image is a projection (minimum intensity) through the entire reconstruction volume. Most of
the phage have not yet injected DNA so the capsids appear full. Such reconstructions are difficult
to obtain by TEM because the phage are shadowed by the bacterium during much of the tilt series
2 STEM Tomography in Biology
49
renders the cell density very similar in most parts of the cell, the eukaryotic cell
organelles and compartments have dramatically different mass densities, allowing
for highly detailed visualization of lipid droplets, mitochondria, endoplasmic
reticulum (ER), actin filaments, microtubules and other cellular components [94].
Examples in Fig. 2.9 depict areas from CSTET reconstructions of breast epithelial
and lung fibroblast cells. The resolution in these tomograms is sufficient to observe
the mitochondrial cristae. Details of data collection are provided in Sect. 2.5. The DF
reconstructions (Fig. 2.9b, d) highlight the areas enriched in higher Z elements, such
as ribosomes (labeled “rib”). Deposits displaying strong contrast within the mitochondrial matrices of the fibroblast cells were analyzed by EDS and found to contain
Ca and P atoms (labeled “CaP” in panels a, b). Such deposits are not present in the
mitochondria of the breast epithelial cell shown here. Unlike most other cellular
features whose contrast inverts from BF to DF, lipid droplets (“ld” in panels c, d)
appear darker in both images. The high lipid density creates a strong BF signal, but
the high concentration of carbon, as opposed to oxygen in the aqueous background,
results in weaker scattering to high angles and a low contrast in the DF. Even such a
small difference in atomic number has a strong effect on the contrast.
2
4 4 4
3
1
2
1
4 4
3
(a)
(b)
(c)
(d)
Fig. 2.6 T-phage attack on an E coli cell. Volumetric rendering of the BF CSTET reconstruction.
The image is a projection (minimum intensity) through the entire reconstruction volume. Most of
the phage have not yet injected DNA so the capsids appear full. Such reconstructions are difficult
to obtain by TEM because the phage are shadowed by the bacterium during much of the tilt series
2 STEM Tomography in Biology
49