

reduced in the pre-NID-processed tomograms (Fig. 11.7 red arrows, and panels c
and d). By contrast, other features such as microtubules (MT) and ribosomes
(R) that do not have the sharp gradient differential characteristic of gold particles,
do not seem to be affected by the pre-NID processing.
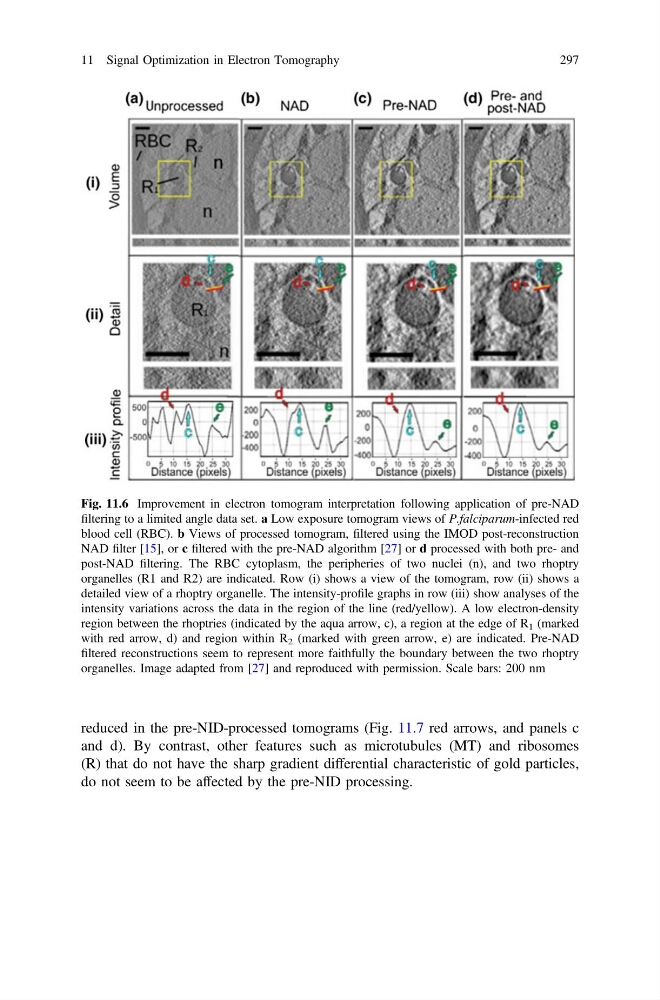
Fig. 11.6 Improvement in electron tomogram interpretation following application of pre-NAD
filtering to a limited angle data set. a Low exposure tomogram views of P.falciparum-infected red
blood cell (RBC). b Views of processed tomogram, filtered using the IMOD post-reconstruction
NAD filter [15], or c filtered with the pre-NAD algorithm [27] or d processed with both pre- and
post-NAD filtering. The RBC cytoplasm, the peripheries of two nuclei (n), and two rhoptry
organelles (R1 and R2) are indicated. Row (i) shows a view of the tomogram, row (ii) shows a
detailed view of a rhoptry organelle. The intensity-profile graphs in row (iii) show analyses of the
intensity variations across the data in the region of the line (red/yellow). A low electron-density
region between the rhoptries (indicated by the aqua arrow, c), a region at the edge of R 1 (marked
with red arrow, d) and region within R 2 (marked with green arrow, e) are indicated. Pre-NAD
filtered reconstructions seem to represent more faithfully the boundary between the two rhoptry
organelles. Image adapted from [27] and reproduced with permission. Scale bars: 200 nm
11 Signal Optimization in Electron Tomography
297
and d). By contrast, other features such as microtubules (MT) and ribosomes
(R) that do not have the sharp gradient differential characteristic of gold particles,
do not seem to be affected by the pre-NID processing.
Fig. 11.6 Improvement in electron tomogram interpretation following application of pre-NAD
filtering to a limited angle data set. a Low exposure tomogram views of P.falciparum-infected red
blood cell (RBC). b Views of processed tomogram, filtered using the IMOD post-reconstruction
NAD filter [15], or c filtered with the pre-NAD algorithm [27] or d processed with both pre- and
post-NAD filtering. The RBC cytoplasm, the peripheries of two nuclei (n), and two rhoptry
organelles (R1 and R2) are indicated. Row (i) shows a view of the tomogram, row (ii) shows a
detailed view of a rhoptry organelle. The intensity-profile graphs in row (iii) show analyses of the
intensity variations across the data in the region of the line (red/yellow). A low electron-density
region between the rhoptries (indicated by the aqua arrow, c), a region at the edge of R 1 (marked
with red arrow, d) and region within R 2 (marked with green arrow, e) are indicated. Pre-NAD
filtered reconstructions seem to represent more faithfully the boundary between the two rhoptry
organelles. Image adapted from [27] and reproduced with permission. Scale bars: 200 nm
11 Signal Optimization in Electron Tomography
297