

where GðrÞ ¼ rI r Á rI r is the edge discriminator, C ¼ 3:31488 is a threshold
parameter [31] and k e is a user defined normalization parameter (typical value is
k e ¼ 30) [44, 45].
The ability of the algorithm to detect edges is thus driven by (11.12), and mainly
depends on how k e and r are set. Large k e forces the algorithm to have an overall
isotropic behavior, while small k e encourages an overall anisotropic behavior of the
filter. Large r makes the algorithm less sensitive to noise, but may blur out features.
In comparison to other NAD filters, including CED, EED has less potential for
inducing spurious details in the image due to noise, mainly due to the gentle
anisotropic behavior of the filter (because k 2 ¼ k 3 ¼ 1). However, due to the inhomogeneous nature of EED, weak edges may be blurred out. This is especially
true when aggressive parameters are used, i.e. large k e , large r, and a large number
of iterations.
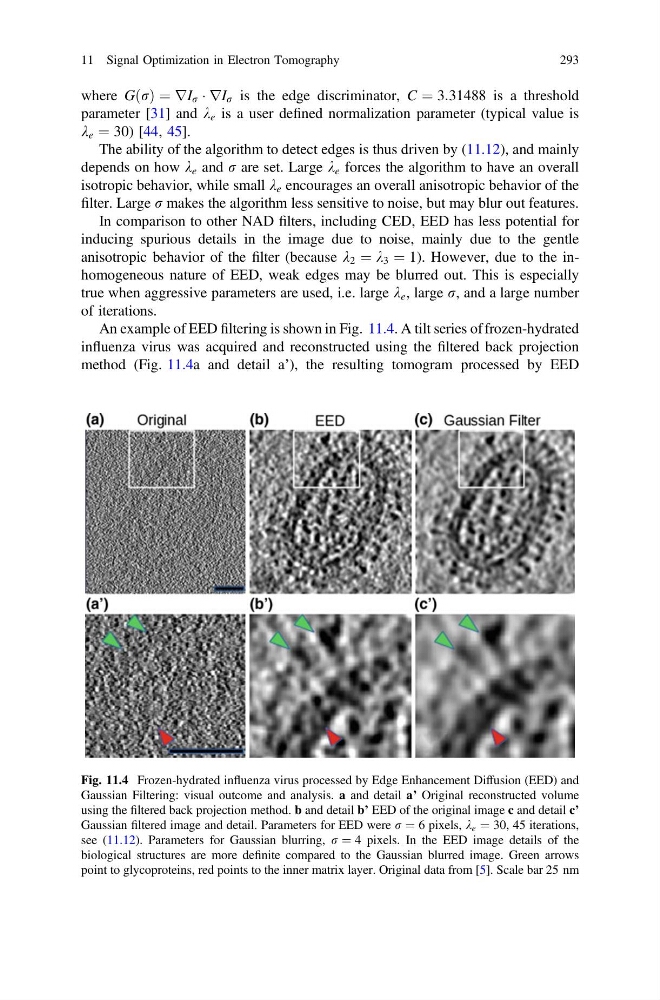
An example of EED filtering is shown in Fig. 11.4. A tilt series of frozen-hydrated
influenza virus was acquired and reconstructed using the filtered back projection
method (Fig. 11.4a and detail a’), the resulting tomogram processed by EED
Fig. 11.4 Frozen-hydrated influenza virus processed by Edge Enhancement Diffusion (EED) and
Gaussian Filtering: visual outcome and analysis. a and detail a’ Original reconstructed volume
using the filtered back projection method. b and detail b’ EED of the original image c and detail c’
Gaussian filtered image and detail. Parameters for EED were r ¼ 6 pixels, k e ¼ 30, 45 iterations,
see (11.12). Parameters for Gaussian blurring, r ¼ 4 pixels. In the EED image details of the
biological structures are more definite compared to the Gaussian blurred image. Green arrows
point to glycoproteins, red points to the inner matrix layer. Original data from [5]. Scale bar 25 nm
11 Signal Optimization in Electron Tomography
293
parameter [31] and k e is a user defined normalization parameter (typical value is
k e ¼ 30) [44, 45].
The ability of the algorithm to detect edges is thus driven by (11.12), and mainly
depends on how k e and r are set. Large k e forces the algorithm to have an overall
isotropic behavior, while small k e encourages an overall anisotropic behavior of the
filter. Large r makes the algorithm less sensitive to noise, but may blur out features.
In comparison to other NAD filters, including CED, EED has less potential for
inducing spurious details in the image due to noise, mainly due to the gentle
anisotropic behavior of the filter (because k 2 ¼ k 3 ¼ 1). However, due to the inhomogeneous nature of EED, weak edges may be blurred out. This is especially
true when aggressive parameters are used, i.e. large k e , large r, and a large number
of iterations.
An example of EED filtering is shown in Fig. 11.4. A tilt series of frozen-hydrated
influenza virus was acquired and reconstructed using the filtered back projection
method (Fig. 11.4a and detail a’), the resulting tomogram processed by EED
Fig. 11.4 Frozen-hydrated influenza virus processed by Edge Enhancement Diffusion (EED) and
Gaussian Filtering: visual outcome and analysis. a and detail a’ Original reconstructed volume
using the filtered back projection method. b and detail b’ EED of the original image c and detail c’
Gaussian filtered image and detail. Parameters for EED were r ¼ 6 pixels, k e ¼ 30, 45 iterations,
see (11.12). Parameters for Gaussian blurring, r ¼ 4 pixels. In the EED image details of the
biological structures are more definite compared to the Gaussian blurred image. Green arrows
point to glycoproteins, red points to the inner matrix layer. Original data from [5]. Scale bar 25 nm
11 Signal Optimization in Electron Tomography
293