

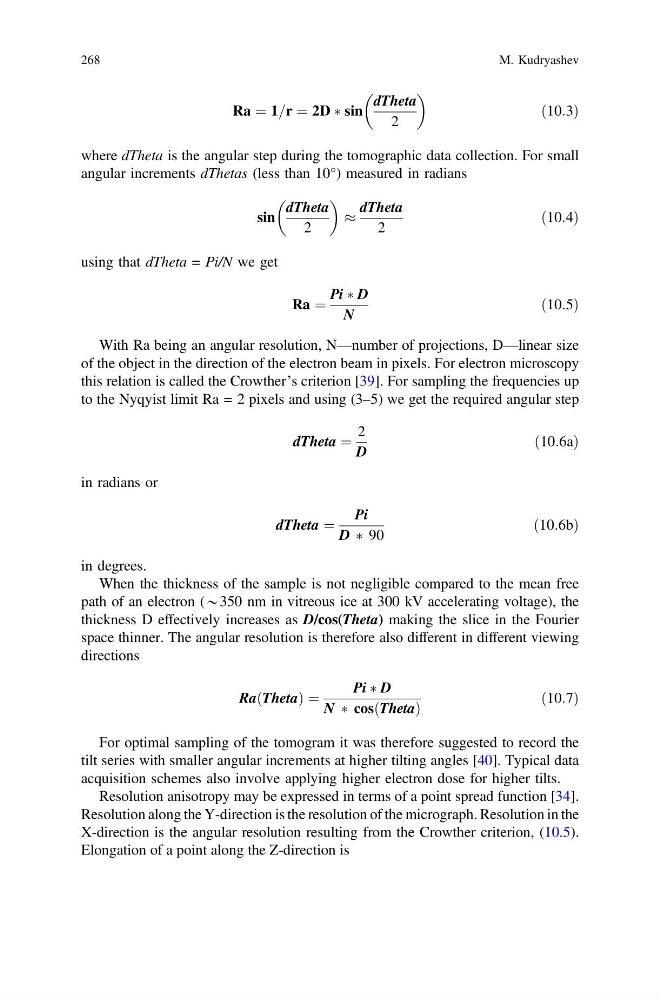
Ra ¼ 1=r ¼ 2D Ã sin
dTheta
2
ð10:3Þ
where dTheta is the angular step during the tomographic data collection. For small
angular increments dThetas (less than 10°) measured in radians
sin
dTheta
2
%
dTheta
2
ð10:4Þ
using that dTheta = Pi/N we get
Ra ¼
Pi à D
N
ð10:5Þ
With Ra being an angular resolution, N—number of projections, D—linear size
of the object in the direction of the electron beam in pixels. For electron microscopy
this relation is called the Crowther’s criterion [39]. For sampling the frequencies up
to the Nyqyist limit Ra = 2 pixels and using (3–5) we get the required angular step
dTheta ¼
2
D
ð10:6aÞ
in radians or
dTheta ¼
Pi
D Ã 90
ð10:6bÞ
in degrees.
When the thickness of the sample is not negligible compared to the mean free
path of an electron (*350 nm in vitreous ice at 300 kV accelerating voltage), the
thickness D effectively increases as D/cos(Theta) making the slice in the Fourier
space thinner. The angular resolution is therefore also different in different viewing
directions
RaðThetaÞ ¼
Pi à D
N Ã cos Theta
ð
Þ
ð10:7Þ
For optimal sampling of the tomogram it was therefore suggested to record the
tilt series with smaller angular increments at higher tilting angles [40]. Typical data
acquisition schemes also involve applying higher electron dose for higher tilts.
Resolution anisotropy may be expressed in terms of a point spread function [34].
Resolution along the Y-direction is the resolution of the micrograph. Resolution in the
X-direction is the angular resolution resulting from the Crowther criterion, (10.5).
Elongation of a point along the Z-direction is
268
M. Kudryashev
dTheta
2
ð10:3Þ
where dTheta is the angular step during the tomographic data collection. For small
angular increments dThetas (less than 10°) measured in radians
sin
dTheta
2
%
dTheta
2
ð10:4Þ
using that dTheta = Pi/N we get
Ra ¼
Pi à D
N
ð10:5Þ
With Ra being an angular resolution, N—number of projections, D—linear size
of the object in the direction of the electron beam in pixels. For electron microscopy
this relation is called the Crowther’s criterion [39]. For sampling the frequencies up
to the Nyqyist limit Ra = 2 pixels and using (3–5) we get the required angular step
dTheta ¼
2
D
ð10:6aÞ
in radians or
dTheta ¼
Pi
D Ã 90
ð10:6bÞ
in degrees.
When the thickness of the sample is not negligible compared to the mean free
path of an electron (*350 nm in vitreous ice at 300 kV accelerating voltage), the
thickness D effectively increases as D/cos(Theta) making the slice in the Fourier
space thinner. The angular resolution is therefore also different in different viewing
directions
RaðThetaÞ ¼
Pi à D
N Ã cos Theta
ð
Þ
ð10:7Þ
For optimal sampling of the tomogram it was therefore suggested to record the
tilt series with smaller angular increments at higher tilting angles [40]. Typical data
acquisition schemes also involve applying higher electron dose for higher tilts.
Resolution anisotropy may be expressed in terms of a point spread function [34].
Resolution along the Y-direction is the resolution of the micrograph. Resolution in the
X-direction is the angular resolution resulting from the Crowther criterion, (10.5).
Elongation of a point along the Z-direction is
268
M. Kudryashev