

200 nm for light with the wavelength of 400 nm. Reduced numerical aperture may
further degrade the resolution.
Wavelength of the electrons of the electron microscope is determined by L = h/p
(Planck constant over the particle impulse) and is 0.039 Å for accelerating voltage
100 kV and 0.022 Å for 300 kV. Since the effective NA for light and electron
microscopes differ, the R for 300 kV is in the order of 0.8 Å [2]. Typical point
resolution of an electron microscope is in the order of 1 Angstrom. Single atoms in
thin films may be routinely observed using modern microscopes [3], however this
cannot be done routinely for the 3DEM modalities described in this book for a
number of reasons described below in this chapter.
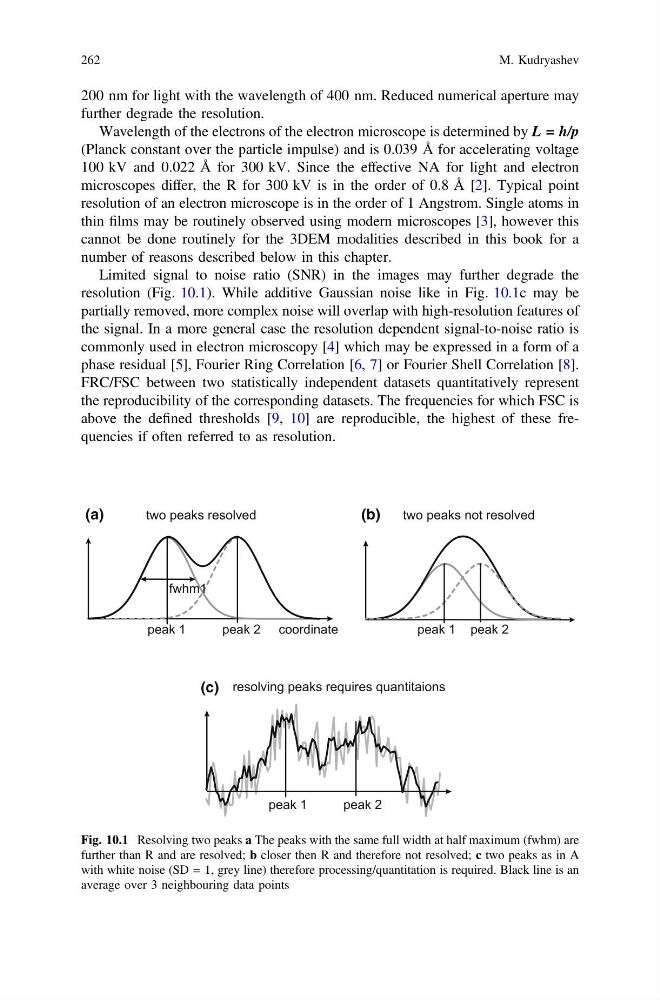
Limited signal to noise ratio (SNR) in the images may further degrade the
resolution (Fig. 10.1). While additive Gaussian noise like in Fig. 10.1c may be
partially removed, more complex noise will overlap with high-resolution features of
the signal. In a more general case the resolution dependent signal-to-noise ratio is
commonly used in electron microscopy [4] which may be expressed in a form of a
phase residual [5], Fourier Ring Correlation [6, 7] or Fourier Shell Correlation [8].
FRC/FSC between two statistically independent datasets quantitatively represent
the reproducibility of the corresponding datasets. The frequencies for which FSC is
above the defined thresholds [9, 10] are reproducible, the highest of these frequencies if often referred to as resolution.
peak 1
peak 2
fwhm1
two peaks resolved
coordinate
peak 1 peak 2
two peaks not resolved
peak 1
peak 2
resolving peaks requires quantitaions
(a)
(b)
(c)
Fig. 10.1 Resolving two peaks a The peaks with the same full width at half maximum (fwhm) are
further than R and are resolved; b closer then R and therefore not resolved; c two peaks as in A
with white noise (SD = 1, grey line) therefore processing/quantitation is required. Black line is an
average over 3 neighbouring data points
262
M. Kudryashev
further degrade the resolution.
Wavelength of the electrons of the electron microscope is determined by L = h/p
(Planck constant over the particle impulse) and is 0.039 Å for accelerating voltage
100 kV and 0.022 Å for 300 kV. Since the effective NA for light and electron
microscopes differ, the R for 300 kV is in the order of 0.8 Å [2]. Typical point
resolution of an electron microscope is in the order of 1 Angstrom. Single atoms in
thin films may be routinely observed using modern microscopes [3], however this
cannot be done routinely for the 3DEM modalities described in this book for a
number of reasons described below in this chapter.
Limited signal to noise ratio (SNR) in the images may further degrade the
resolution (Fig. 10.1). While additive Gaussian noise like in Fig. 10.1c may be
partially removed, more complex noise will overlap with high-resolution features of
the signal. In a more general case the resolution dependent signal-to-noise ratio is
commonly used in electron microscopy [4] which may be expressed in a form of a
phase residual [5], Fourier Ring Correlation [6, 7] or Fourier Shell Correlation [8].
FRC/FSC between two statistically independent datasets quantitatively represent
the reproducibility of the corresponding datasets. The frequencies for which FSC is
above the defined thresholds [9, 10] are reproducible, the highest of these frequencies if often referred to as resolution.
peak 1
peak 2
fwhm1
two peaks resolved
coordinate
peak 1 peak 2
two peaks not resolved
peak 1
peak 2
resolving peaks requires quantitaions
(a)
(b)
(c)
Fig. 10.1 Resolving two peaks a The peaks with the same full width at half maximum (fwhm) are
further than R and are resolved; b closer then R and therefore not resolved; c two peaks as in A
with white noise (SD = 1, grey line) therefore processing/quantitation is required. Black line is an
average over 3 neighbouring data points
262
M. Kudryashev