

works [10, 12–17]. A much more detailed description of the projection mathematics
can be found at [18].
After having determined the landmark chains, it is possible to precisely compute
the orientation of the tilt axis by finding the matrices A i;tiltAxis and residual shifts s i .
If there are N projections in the tilt series, we need to estimate N projections angles (the
small rotations suffered by each projection), 2N projections shift parameters (x; y shifts
per image), and 2 parameters for the orientation of the tilt axis with respect to the
electron beam. This makes a total of 3N projections þ 2 parameters. However, the
process requires the estimation of the auxiliary variables r j . Thus, if we have an
average of N chains landmark chains per image, each with a x; y; z
ð
Þ location, there
would be a total of 3N chains N projections extra parameters to estimate. Each point in the
landmark chain brings 2 equations for an overdetermined equation system, and let
us assume that on average the length of a chain is L chain . Then, there are
2N chains N projections L chain equations and 3N projections N chains þ 1
ð
Þþ2 unknowns. The
ratio between the number of equations and the number of unknowns is approximately 2=3L chain . A typical value of L chain is between 10 and 50, meaning that this
is a highly overdetermined equation system. Therefore, this equation system can be
easily solved by Least Squares [10, 12, 16], or by Least Squares combined with
some statistically robust technique [14, 18].
An important problem of the construction of the landmark chains is the problem
of landmark occlusion (illustrated in Fig. 7.10). When the projection of two landmarks overlaps, algorithms have difficulties in deciding which 2D landmarks go with
which, and landmark chains are sometimes misconstrued mixing projections from
several 3D landmarks. A robust resolution of the equation system at (7.1) tends to
mitigate this effect.
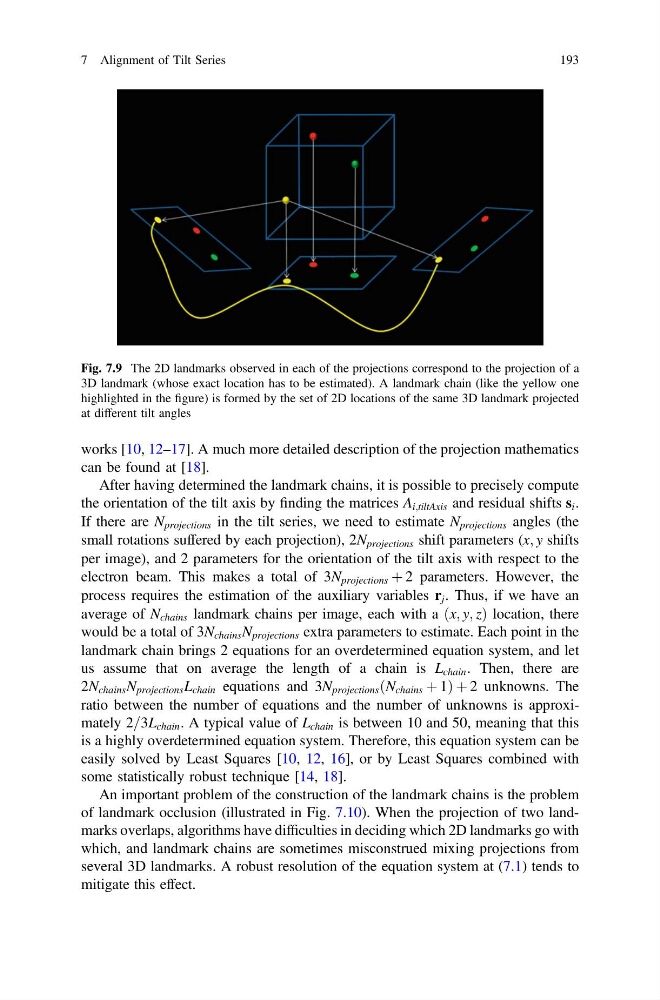
Fig. 7.9 The 2D landmarks observed in each of the projections correspond to the projection of a
3D landmark (whose exact location has to be estimated). A landmark chain (like the yellow one
highlighted in the figure) is formed by the set of 2D locations of the same 3D landmark projected
at different tilt angles
7 Alignment of Tilt Series
193
can be found at [18].
After having determined the landmark chains, it is possible to precisely compute
the orientation of the tilt axis by finding the matrices A i;tiltAxis and residual shifts s i .
If there are N projections in the tilt series, we need to estimate N projections angles (the
small rotations suffered by each projection), 2N projections shift parameters (x; y shifts
per image), and 2 parameters for the orientation of the tilt axis with respect to the
electron beam. This makes a total of 3N projections þ 2 parameters. However, the
process requires the estimation of the auxiliary variables r j . Thus, if we have an
average of N chains landmark chains per image, each with a x; y; z
ð
Þ location, there
would be a total of 3N chains N projections extra parameters to estimate. Each point in the
landmark chain brings 2 equations for an overdetermined equation system, and let
us assume that on average the length of a chain is L chain . Then, there are
2N chains N projections L chain equations and 3N projections N chains þ 1
ð
Þþ2 unknowns. The
ratio between the number of equations and the number of unknowns is approximately 2=3L chain . A typical value of L chain is between 10 and 50, meaning that this
is a highly overdetermined equation system. Therefore, this equation system can be
easily solved by Least Squares [10, 12, 16], or by Least Squares combined with
some statistically robust technique [14, 18].
An important problem of the construction of the landmark chains is the problem
of landmark occlusion (illustrated in Fig. 7.10). When the projection of two landmarks overlaps, algorithms have difficulties in deciding which 2D landmarks go with
which, and landmark chains are sometimes misconstrued mixing projections from
several 3D landmarks. A robust resolution of the equation system at (7.1) tends to
mitigate this effect.
Fig. 7.9 The 2D landmarks observed in each of the projections correspond to the projection of a
3D landmark (whose exact location has to be estimated). A landmark chain (like the yellow one
highlighted in the figure) is formed by the set of 2D locations of the same 3D landmark projected
at different tilt angles
7 Alignment of Tilt Series
193