

minima features detected by TomoJ). Even small pieces of the image have been
used once an initial alignment is manually provided by the user [11].
In many experiments, gold beads (seen as black dots in the images due to the
high electron density of gold with respect to the biological material) are added to
the sample. If case that they do not aggregate and that their distribution is good
enough and uniform over the region of interest, they can be used as fiducial markers
that can be easily tracked along the tilt series and so improve quality of alignment.
However, adding gold beads is not strictly required for the alignment process
because, even if gold beads are available, points that can be safely tracked along the
tilt series can be frequently identified in the dataset. For instance, some of the points
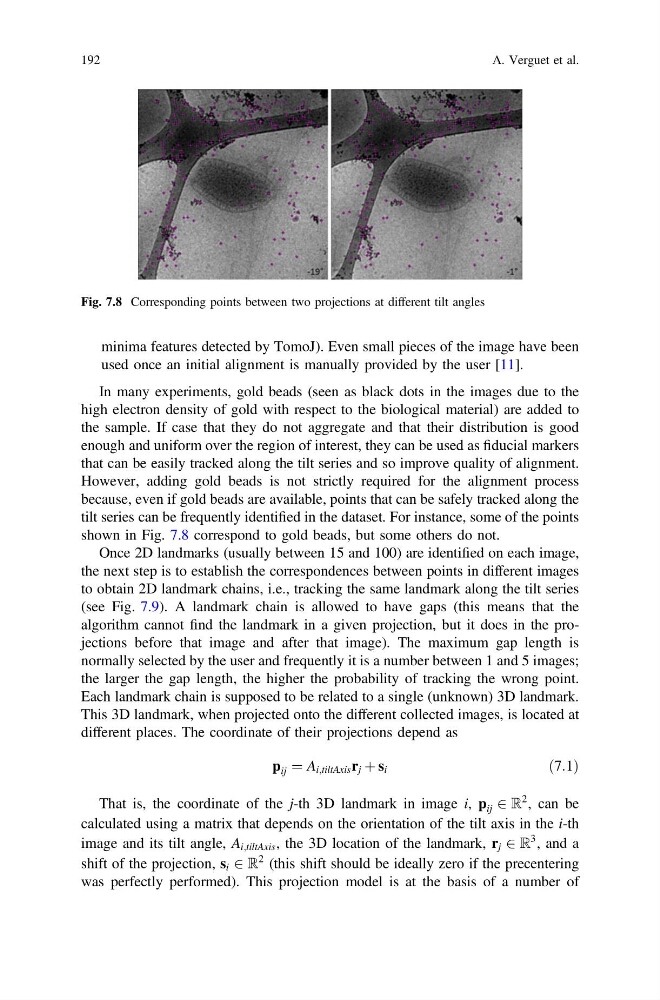
shown in Fig. 7.8 correspond to gold beads, but some others do not.
Once 2D landmarks (usually between 15 and 100) are identified on each image,
the next step is to establish the correspondences between points in different images
to obtain 2D landmark chains, i.e., tracking the same landmark along the tilt series
(see Fig. 7.9). A landmark chain is allowed to have gaps (this means that the
algorithm cannot find the landmark in a given projection, but it does in the projections before that image and after that image). The maximum gap length is
normally selected by the user and frequently it is a number between 1 and 5 images;
the larger the gap length, the higher the probability of tracking the wrong point.
Each landmark chain is supposed to be related to a single (unknown) 3D landmark.
This 3D landmark, when projected onto the different collected images, is located at
different places. The coordinate of their projections depend as
p ij ¼ A i;tiltAxis r j þ s i
ð7:1Þ
That is, the coordinate of the j-th 3D landmark in image i, p ij 2 R
2 , can be
calculated using a matrix that depends on the orientation of the tilt axis in the i-th
image and its tilt angle, A i;tiltAxis , the 3D location of the landmark, r j 2 R
3 , and a
shift of the projection, s i 2 R
2 (this shift should be ideally zero if the precentering
was perfectly performed). This projection model is at the basis of a number of
Fig. 7.8 Corresponding points between two projections at different tilt angles
192
A. Verguet et al.
used once an initial alignment is manually provided by the user [11].
In many experiments, gold beads (seen as black dots in the images due to the
high electron density of gold with respect to the biological material) are added to
the sample. If case that they do not aggregate and that their distribution is good
enough and uniform over the region of interest, they can be used as fiducial markers
that can be easily tracked along the tilt series and so improve quality of alignment.
However, adding gold beads is not strictly required for the alignment process
because, even if gold beads are available, points that can be safely tracked along the
tilt series can be frequently identified in the dataset. For instance, some of the points
shown in Fig. 7.8 correspond to gold beads, but some others do not.
Once 2D landmarks (usually between 15 and 100) are identified on each image,
the next step is to establish the correspondences between points in different images
to obtain 2D landmark chains, i.e., tracking the same landmark along the tilt series
(see Fig. 7.9). A landmark chain is allowed to have gaps (this means that the
algorithm cannot find the landmark in a given projection, but it does in the projections before that image and after that image). The maximum gap length is
normally selected by the user and frequently it is a number between 1 and 5 images;
the larger the gap length, the higher the probability of tracking the wrong point.
Each landmark chain is supposed to be related to a single (unknown) 3D landmark.
This 3D landmark, when projected onto the different collected images, is located at
different places. The coordinate of their projections depend as
p ij ¼ A i;tiltAxis r j þ s i
ð7:1Þ
That is, the coordinate of the j-th 3D landmark in image i, p ij 2 R
2 , can be
calculated using a matrix that depends on the orientation of the tilt axis in the i-th
image and its tilt angle, A i;tiltAxis , the 3D location of the landmark, r j 2 R
3 , and a
shift of the projection, s i 2 R
2 (this shift should be ideally zero if the precentering
was perfectly performed). This projection model is at the basis of a number of
Fig. 7.8 Corresponding points between two projections at different tilt angles
192
A. Verguet et al.