

The reason is that each slice can be reconstructed independently using the pixel
values observed in each one of the rows of the aligned images.
Nevertheless, the accurate estimation of the direction of the tilt axis is not always
possible from prealigned projections for different reasons: (1) the goniometer
instabilities can induce some in-plane rotations which make the orientation of the tilt
axis to be slightly different in each image; (2) our precentering of the images
(previous section) is normally far from a perfect algorithm and although major
movements have been corrected, there is still a non-negligible amount of shift
between successive images; (3) more subtle, small errors during the centering of
images may accumulate along the tilt series, so that there is an important accumulated
drift from the beginning of the tilt series to its end. This latter error is the responsible
of the “banana” shapes observed at the 3D reconstruction of misaligned tilt series.
Therefore, the accurate determination of the tilt axis direction in each one of the
images is the most delicate process in the alignment process. For doing so, we need
to identify corresponding points along the tilt series (see Fig. 7.8). These corresponding points in the projections are called 2D landmarks and they can be identified by different approaches:
• Manual, where markers are selected in each image of the tilt-series. The interest
is the manual validation of corresponding points. However, the location of
points are imprecise (a few pixels precision) and the process is not reproducible
and time-consuming.
• Semi-automatic, where landmarks are manually selected on one image and the
corresponding location on the other images is performed automatically. The
interest is the manual selection of interesting points to track with an improvement of reproducibility and time consumption.
• Fully automatic, where the 2D landmarks are identified as any outstanding
image feature like local maxima or minima [9] (Chap. 6), Harris corners [10], or
any other feature detection algorithm could be employed (Fig. 7.8 show local
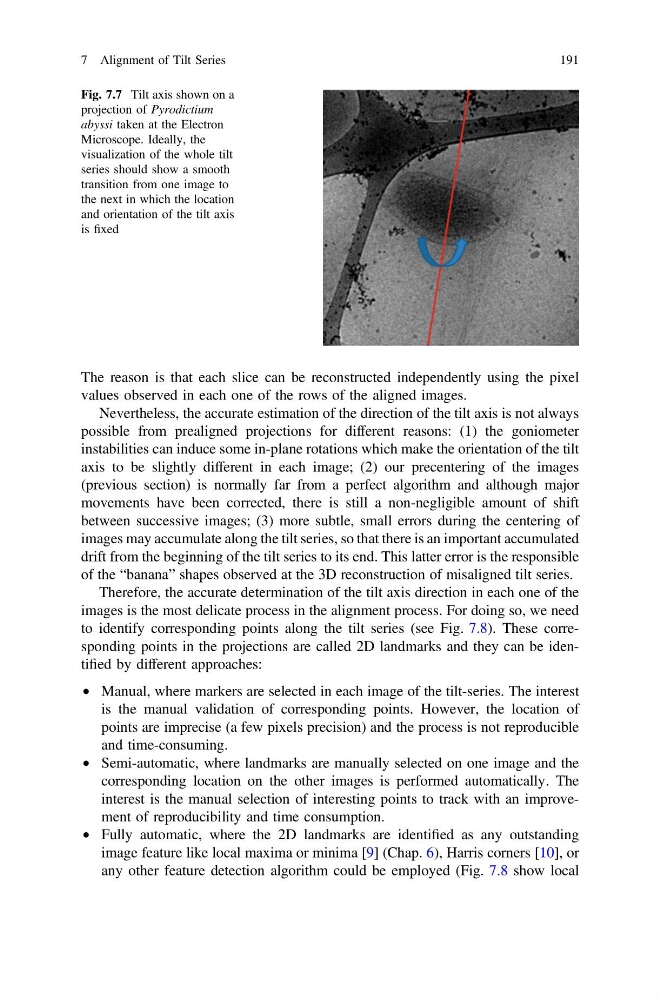
Fig. 7.7 Tilt axis shown on a
projection of Pyrodictium
abyssi taken at the Electron
Microscope. Ideally, the
visualization of the whole tilt
series should show a smooth
transition from one image to
the next in which the location
and orientation of the tilt axis
is fixed
7 Alignment of Tilt Series
191
values observed in each one of the rows of the aligned images.
Nevertheless, the accurate estimation of the direction of the tilt axis is not always
possible from prealigned projections for different reasons: (1) the goniometer
instabilities can induce some in-plane rotations which make the orientation of the tilt
axis to be slightly different in each image; (2) our precentering of the images
(previous section) is normally far from a perfect algorithm and although major
movements have been corrected, there is still a non-negligible amount of shift
between successive images; (3) more subtle, small errors during the centering of
images may accumulate along the tilt series, so that there is an important accumulated
drift from the beginning of the tilt series to its end. This latter error is the responsible
of the “banana” shapes observed at the 3D reconstruction of misaligned tilt series.
Therefore, the accurate determination of the tilt axis direction in each one of the
images is the most delicate process in the alignment process. For doing so, we need
to identify corresponding points along the tilt series (see Fig. 7.8). These corresponding points in the projections are called 2D landmarks and they can be identified by different approaches:
• Manual, where markers are selected in each image of the tilt-series. The interest
is the manual validation of corresponding points. However, the location of
points are imprecise (a few pixels precision) and the process is not reproducible
and time-consuming.
• Semi-automatic, where landmarks are manually selected on one image and the
corresponding location on the other images is performed automatically. The
interest is the manual selection of interesting points to track with an improvement of reproducibility and time consumption.
• Fully automatic, where the 2D landmarks are identified as any outstanding
image feature like local maxima or minima [9] (Chap. 6), Harris corners [10], or
any other feature detection algorithm could be employed (Fig. 7.8 show local
Fig. 7.7 Tilt axis shown on a
projection of Pyrodictium
abyssi taken at the Electron
Microscope. Ideally, the
visualization of the whole tilt
series should show a smooth
transition from one image to
the next in which the location
and orientation of the tilt axis
is fixed
7 Alignment of Tilt Series
191