

synapses do not have immunodetectable levels of gephyrin. In order to improve
light-level synapse detection, conjugate IF-SEM array tomography can be used in
future studies to screen for markers that are specifically enriched on the postsynaptic
side of excitatory synapses of very small size, or those contacting GABA dendrites, as
well as of inhibitory synapses.
Another area where conjugate IF-SEM array tomography is finding successful
application is the study of myelinated axons in the central nervous system (CNS) [58].
The size of myelinated axons (>200 nm in diameter), and the abundance of myelin
proteins, such as myelin basic protein (MBP), make them an ideal target for
immunofluorescence AT detection (Fig. 6.7). The ultrathin sections provide easy
access for the antibodies against MBP and do not require lipid extraction. In addition,
the use of ultrathin sections ensures that antigens can be detected equally well within
myelinated and unmyelinated portions of the axon, which is in contrast to
pre-embedding immunocytochemistry where myelinated portions of axons are much
more weakly stained [59]. Even though myelinated axons can be easily resolved and
traced using only immunofluorescence, the ability to use conjugate SEM adds
important advantages. SEM imaging of small subvolumes selected from a much
larger IF imaged volume, allows for quality control of tissue preservation and
antibody performance, as well as for developing rules of correlation between
immunofluorescence and ultrastructure. For example, conjugate light-electron AT
confirms that immunofluorescence for MBP precisely outlines the myelinated sheaths
of axons and can be used to estimate their thickness (Fig. 6.7f ). Using these methods,
together with an independently performed analysis of a publicly hosted EM dataset
[60], we found that approximately half of all myelinated axons in layers 2/3 and a
quarter in layer 4 in cortical gray matter arise from inhibitory interneurons with local
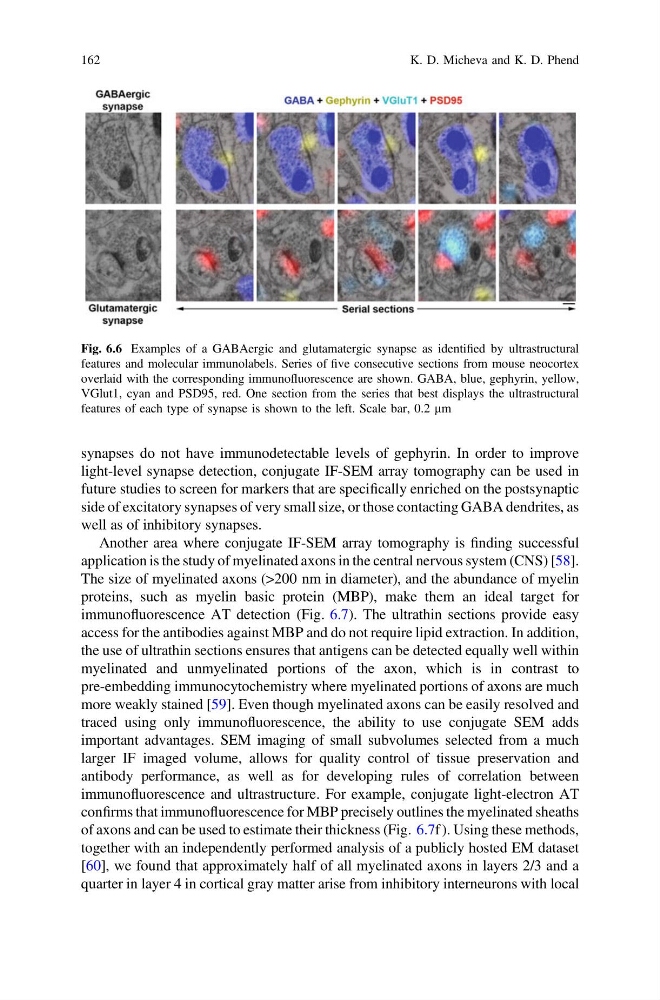
Fig. 6.6 Examples of a GABAergic and glutamatergic synapse as identified by ultrastructural
features and molecular immunolabels. Series of five consecutive sections from mouse neocortex
overlaid with the corresponding immunofluorescence are shown. GABA, blue, gephyrin, yellow,
VGlut1, cyan and PSD95, red. One section from the series that best displays the ultrastructural
features of each type of synapse is shown to the left. Scale bar, 0.2 lm
162
K. D. Micheva and K. D. Phend
light-level synapse detection, conjugate IF-SEM array tomography can be used in
future studies to screen for markers that are specifically enriched on the postsynaptic
side of excitatory synapses of very small size, or those contacting GABA dendrites, as
well as of inhibitory synapses.
Another area where conjugate IF-SEM array tomography is finding successful
application is the study of myelinated axons in the central nervous system (CNS) [58].
The size of myelinated axons (>200 nm in diameter), and the abundance of myelin
proteins, such as myelin basic protein (MBP), make them an ideal target for
immunofluorescence AT detection (Fig. 6.7). The ultrathin sections provide easy
access for the antibodies against MBP and do not require lipid extraction. In addition,
the use of ultrathin sections ensures that antigens can be detected equally well within
myelinated and unmyelinated portions of the axon, which is in contrast to
pre-embedding immunocytochemistry where myelinated portions of axons are much
more weakly stained [59]. Even though myelinated axons can be easily resolved and
traced using only immunofluorescence, the ability to use conjugate SEM adds
important advantages. SEM imaging of small subvolumes selected from a much
larger IF imaged volume, allows for quality control of tissue preservation and
antibody performance, as well as for developing rules of correlation between
immunofluorescence and ultrastructure. For example, conjugate light-electron AT
confirms that immunofluorescence for MBP precisely outlines the myelinated sheaths
of axons and can be used to estimate their thickness (Fig. 6.7f ). Using these methods,
together with an independently performed analysis of a publicly hosted EM dataset
[60], we found that approximately half of all myelinated axons in layers 2/3 and a
quarter in layer 4 in cortical gray matter arise from inhibitory interneurons with local
Fig. 6.6 Examples of a GABAergic and glutamatergic synapse as identified by ultrastructural
features and molecular immunolabels. Series of five consecutive sections from mouse neocortex
overlaid with the corresponding immunofluorescence are shown. GABA, blue, gephyrin, yellow,
VGlut1, cyan and PSD95, red. One section from the series that best displays the ultrastructural
features of each type of synapse is shown to the left. Scale bar, 0.2 lm
162
K. D. Micheva and K. D. Phend