

6.6 Application of Conjugate IF-SEM Array Tomography
for the Study of Mammalian Synapses and Axons
Mammalian synapses are small, usually submicron structures, which are highly
diverse in their structure and molecular composition. This presents unique challenges for their imaging and requires the combination of different approaches to
obtain a comprehensive view of individual synapses. The first glimpses of synapses
were obtained using electron microscopy [53–55], and this remains the method of
choice for identifying synapses and studying their ultrastructure. Conjugate IF-SEM
array tomography adds an important facet to the study of the synaptic architecture
of the brain by providing information on the molecular content of ultrastructurally
identified individual synapses.
The great majority of mammalian neocortical synapses fall within two basic categories: excitatory glutamatergic (*80%) and inhibitory GABAergic (*15–20%).
These two categories are characterized by the expression of distinct molecular
markers, for example, the postsynaptic densities of excitatory synapses in cortex are
enriched in PSD95, while the inhibitory postsynaptic densities generally express
gephyrin (Fig. 6.6). On the presynaptic side, excitatory synapses express vesicular
glutamate transporters (VGluTs), with the majority containing VGluT1, and a smaller
population, mostly concentrated in layer 4, VGluT2 [56, 57]. Inhibitory synapses
contain the vesicular GABA transporter (VGAT). Both types of synapses also contain
synapsin, synaptophysin and other general synaptic markers. Various combinations
of general synaptic markers and markers for specific synapse types can be used to
identify synapses at the light level; while synapse detection in this case is not as
conclusive due to resolution limitations, it allows a more efficient sampling of much
larger numbers of synapses compared to electron microscopy. However, at the light
level it is impossible to estimate how many synapses escape detection using this
approach. This is where conjugate IF-SEM array tomography can be instrumental to
assess the efficiency of synaptic markers and their combinations for synapse detection. For example, a recent study confirmed that immunofluorescence for PSD95 is
present at the great majority of excitatory synapses (95%; [18]), and also found two
populations of synapses that are likely to escape detection by PSD95
immunofluorescence: very small synapses and synapses onto GABA dendrites, both
of which tend to be much more weakly labelled for PSD95. For inhibitory
GABAergic synapses, the same study revealed that gephyrin is not as reliable a
postsynaptic marker as PSD95, because approximately one quarter of inhibitory
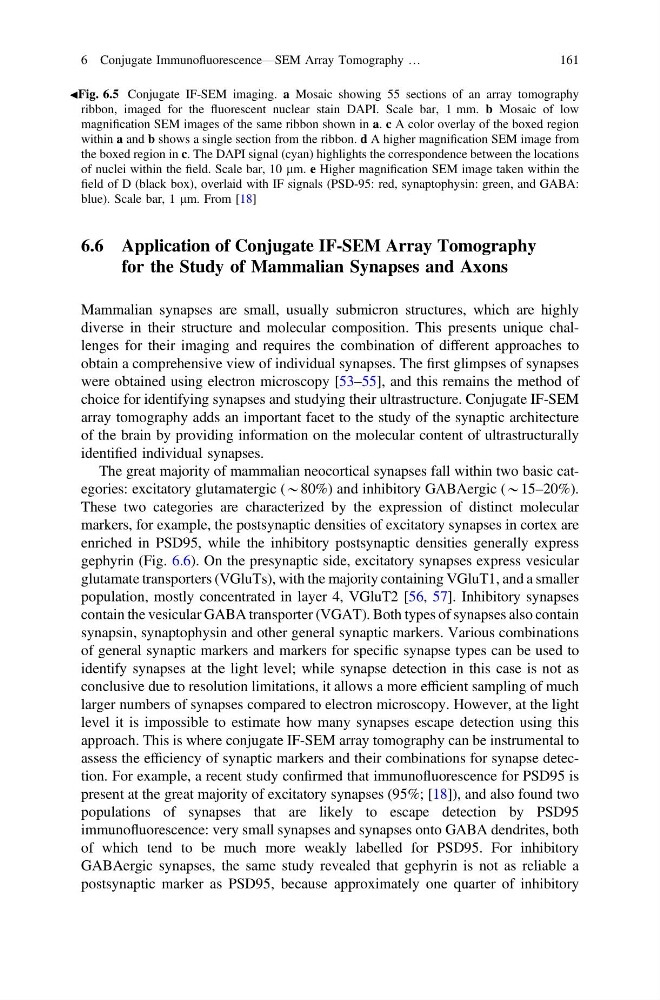
JFig. 6.5 Conjugate IF-SEM imaging. a Mosaic showing 55 sections of an array tomography
ribbon, imaged for the fluorescent nuclear stain DAPI. Scale bar, 1 mm. b Mosaic of low
magnification SEM images of the same ribbon shown in a. c A color overlay of the boxed region
within a and b shows a single section from the ribbon. d A higher magnification SEM image from
the boxed region in c. The DAPI signal (cyan) highlights the correspondence between the locations
of nuclei within the field. Scale bar, 10 lm. e Higher magnification SEM image taken within the
field of D (black box), overlaid with IF signals (PSD-95: red, synaptophysin: green, and GABA:
blue). Scale bar, 1 lm. From [18]
6 Conjugate Immunofluorescence—SEM Array Tomography …
161
for the Study of Mammalian Synapses and Axons
Mammalian synapses are small, usually submicron structures, which are highly
diverse in their structure and molecular composition. This presents unique challenges for their imaging and requires the combination of different approaches to
obtain a comprehensive view of individual synapses. The first glimpses of synapses
were obtained using electron microscopy [53–55], and this remains the method of
choice for identifying synapses and studying their ultrastructure. Conjugate IF-SEM
array tomography adds an important facet to the study of the synaptic architecture
of the brain by providing information on the molecular content of ultrastructurally
identified individual synapses.
The great majority of mammalian neocortical synapses fall within two basic categories: excitatory glutamatergic (*80%) and inhibitory GABAergic (*15–20%).
These two categories are characterized by the expression of distinct molecular
markers, for example, the postsynaptic densities of excitatory synapses in cortex are
enriched in PSD95, while the inhibitory postsynaptic densities generally express
gephyrin (Fig. 6.6). On the presynaptic side, excitatory synapses express vesicular
glutamate transporters (VGluTs), with the majority containing VGluT1, and a smaller
population, mostly concentrated in layer 4, VGluT2 [56, 57]. Inhibitory synapses
contain the vesicular GABA transporter (VGAT). Both types of synapses also contain
synapsin, synaptophysin and other general synaptic markers. Various combinations
of general synaptic markers and markers for specific synapse types can be used to
identify synapses at the light level; while synapse detection in this case is not as
conclusive due to resolution limitations, it allows a more efficient sampling of much
larger numbers of synapses compared to electron microscopy. However, at the light
level it is impossible to estimate how many synapses escape detection using this
approach. This is where conjugate IF-SEM array tomography can be instrumental to
assess the efficiency of synaptic markers and their combinations for synapse detection. For example, a recent study confirmed that immunofluorescence for PSD95 is
present at the great majority of excitatory synapses (95%; [18]), and also found two
populations of synapses that are likely to escape detection by PSD95
immunofluorescence: very small synapses and synapses onto GABA dendrites, both
of which tend to be much more weakly labelled for PSD95. For inhibitory
GABAergic synapses, the same study revealed that gephyrin is not as reliable a
postsynaptic marker as PSD95, because approximately one quarter of inhibitory
JFig. 6.5 Conjugate IF-SEM imaging. a Mosaic showing 55 sections of an array tomography
ribbon, imaged for the fluorescent nuclear stain DAPI. Scale bar, 1 mm. b Mosaic of low
magnification SEM images of the same ribbon shown in a. c A color overlay of the boxed region
within a and b shows a single section from the ribbon. d A higher magnification SEM image from
the boxed region in c. The DAPI signal (cyan) highlights the correspondence between the locations
of nuclei within the field. Scale bar, 10 lm. e Higher magnification SEM image taken within the
field of D (black box), overlaid with IF signals (PSD-95: red, synaptophysin: green, and GABA:
blue). Scale bar, 1 lm. From [18]
6 Conjugate Immunofluorescence—SEM Array Tomography …
161