

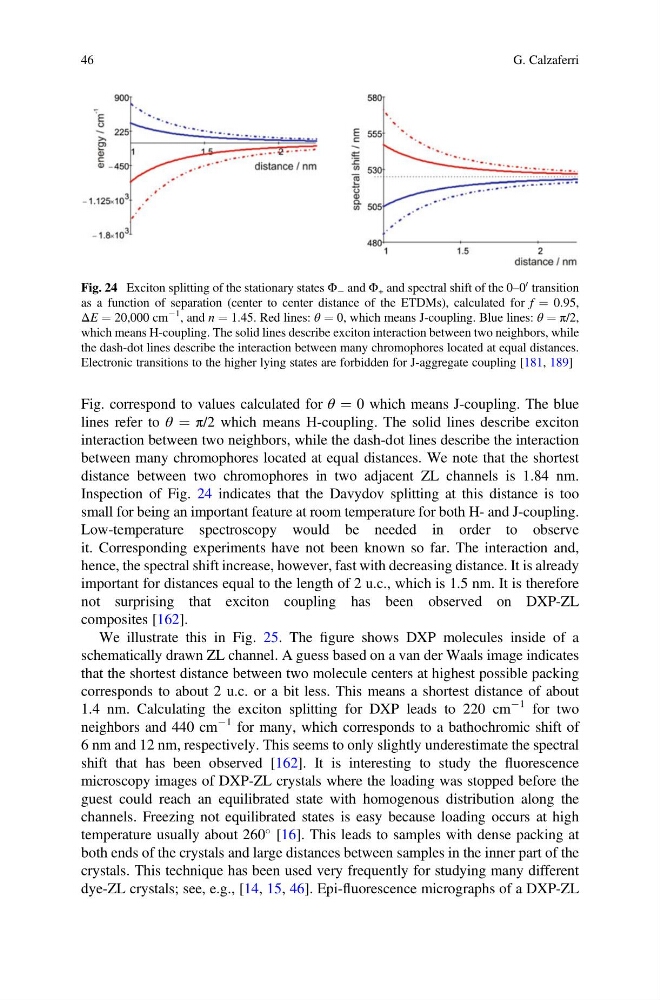
Fig. correspond to values calculated for θ ¼ 0 which means J-coupling. The blue
lines refer to θ ¼ π/2 which means H-coupling. The solid lines describe exciton
interaction between two neighbors, while the dash-dot lines describe the interaction
between many chromophores located at equal distances. We note that the shortest
distance between two chromophores in two adjacent ZL channels is 1.84 nm.
Inspection of Fig. 24 indicates that the Davydov splitting at this distance is too
small for being an important feature at room temperature for both H- and J-coupling.
Low-temperature spectroscopy would be needed in order to observe
it. Corresponding experiments have not been known so far. The interaction and,
hence, the spectral shift increase, however, fast with decreasing distance. It is already
important for distances equal to the length of 2 u.c., which is 1.5 nm. It is therefore
not surprising that exciton coupling has been observed on DXP-ZL
composites [162].
We illustrate this in Fig. 25. The figure shows DXP molecules inside of a
schematically drawn ZL channel. A guess based on a van der Waals image indicates
that the shortest distance between two molecule centers at highest possible packing
corresponds to about 2 u.c. or a bit less. This means a shortest distance of about
1.4 nm. Calculating the exciton splitting for DXP leads to 220 cm
À1 for two
neighbors and 440 cm
À1 for many, which corresponds to a bathochromic shift of
6 nm and 12 nm, respectively. This seems to only slightly underestimate the spectral
shift that has been observed [162]. It is interesting to study the fluorescence
microscopy images of DXP-ZL crystals where the loading was stopped before the
guest could reach an equilibrated state with homogenous distribution along the
channels. Freezing not equilibrated states is easy because loading occurs at high
temperature usually about 260
[16]. This leads to samples with dense packing at
both ends of the crystals and large distances between samples in the inner part of the
crystals. This technique has been used very frequently for studying many different
dye-ZL crystals; see, e.g., [14, 15, 46]. Epi-fluorescence micrographs of a DXP-ZL
Fig. 24 Exciton splitting of the stationary states Φ À and Φ + and spectral shift of the 0–0
0 transition
as a function of separation (center to center distance of the ETDMs), calculated for f ¼ 0.95,
ΔE ¼ 20,000 cm
À1
, and n ¼ 1.45. Red lines: θ ¼ 0, which means J-coupling. Blue lines: θ ¼ π/2,
which means H-coupling. The solid lines describe exciton interaction between two neighbors, while
the dash-dot lines describe the interaction between many chromophores located at equal distances.
Electronic transitions to the higher lying states are forbidden for J-aggregate coupling [181, 189]
46
G. Calzaferri
lines refer to θ ¼ π/2 which means H-coupling. The solid lines describe exciton
interaction between two neighbors, while the dash-dot lines describe the interaction
between many chromophores located at equal distances. We note that the shortest
distance between two chromophores in two adjacent ZL channels is 1.84 nm.
Inspection of Fig. 24 indicates that the Davydov splitting at this distance is too
small for being an important feature at room temperature for both H- and J-coupling.
Low-temperature spectroscopy would be needed in order to observe
it. Corresponding experiments have not been known so far. The interaction and,
hence, the spectral shift increase, however, fast with decreasing distance. It is already
important for distances equal to the length of 2 u.c., which is 1.5 nm. It is therefore
not surprising that exciton coupling has been observed on DXP-ZL
composites [162].
We illustrate this in Fig. 25. The figure shows DXP molecules inside of a
schematically drawn ZL channel. A guess based on a van der Waals image indicates
that the shortest distance between two molecule centers at highest possible packing
corresponds to about 2 u.c. or a bit less. This means a shortest distance of about
1.4 nm. Calculating the exciton splitting for DXP leads to 220 cm
À1 for two
neighbors and 440 cm
À1 for many, which corresponds to a bathochromic shift of
6 nm and 12 nm, respectively. This seems to only slightly underestimate the spectral
shift that has been observed [162]. It is interesting to study the fluorescence
microscopy images of DXP-ZL crystals where the loading was stopped before the
guest could reach an equilibrated state with homogenous distribution along the
channels. Freezing not equilibrated states is easy because loading occurs at high
temperature usually about 260
[16]. This leads to samples with dense packing at
both ends of the crystals and large distances between samples in the inner part of the
crystals. This technique has been used very frequently for studying many different
dye-ZL crystals; see, e.g., [14, 15, 46]. Epi-fluorescence micrographs of a DXP-ZL
Fig. 24 Exciton splitting of the stationary states Φ À and Φ + and spectral shift of the 0–0
0 transition
as a function of separation (center to center distance of the ETDMs), calculated for f ¼ 0.95,
ΔE ¼ 20,000 cm
À1
, and n ¼ 1.45. Red lines: θ ¼ 0, which means J-coupling. Blue lines: θ ¼ π/2,
which means H-coupling. The solid lines describe exciton interaction between two neighbors, while
the dash-dot lines describe the interaction between many chromophores located at equal distances.
Electronic transitions to the higher lying states are forbidden for J-aggregate coupling [181, 189]
46
G. Calzaferri