

l μà ¼ const
ffiffiffiffiffiffiffi
f
ΔE
r
ð13Þ
From Eq. (13) we find, as an example, the length of the ETDM of an organic
molecule absorbing light at 500 nm with oscillator strength one to be 0.215 nm. This
means that the distance R between the ETDM of two adjacent molecules in a
nanochannel of interest here is usually large enough, so that Eq. (12) can be
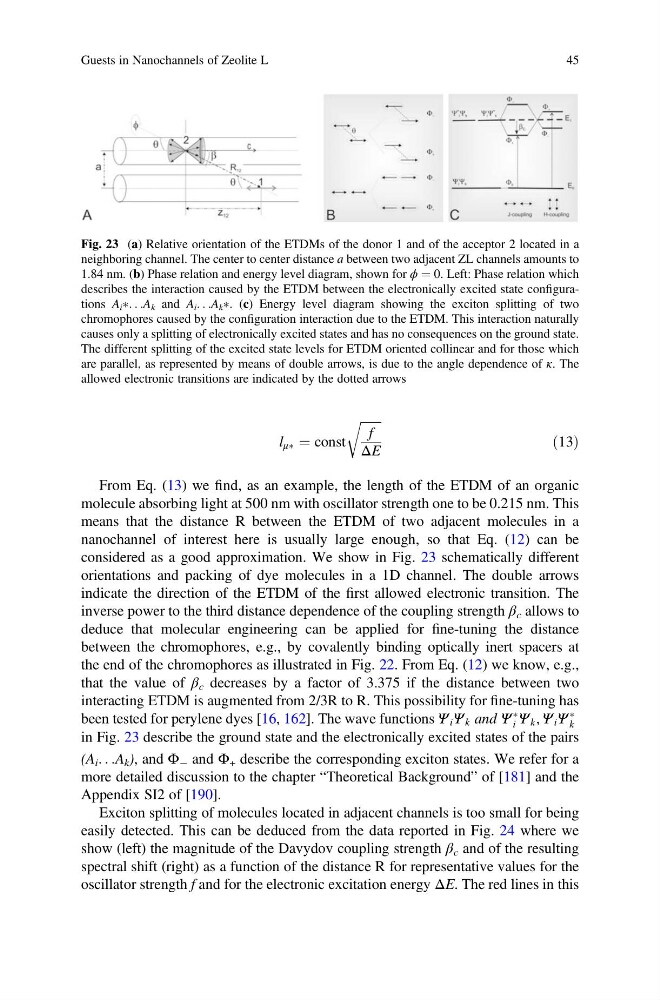
considered as a good approximation. We show in Fig. 23 schematically different
orientations and packing of dye molecules in a 1D channel. The double arrows
indicate the direction of the ETDM of the first allowed electronic transition. The
inverse power to the third distance dependence of the coupling strength β c allows to
deduce that molecular engineering can be applied for fine-tuning the distance
between the chromophores, e.g., by covalently binding optically inert spacers at
the end of the chromophores as illustrated in Fig. 22. From Eq. (12) we know, e.g.,
that the value of β c decreases by a factor of 3.375 if the distance between two
interacting ETDM is augmented from 2/3R to R. This possibility for fine-tuning has
been tested for perylene dyes [16, 162]. The wave functions Ψ i Ψ k and Ψ
Ã
i Ψ k , Ψ i Ψ
Ã
k
in Fig. 23 describe the ground state and the electronically excited states of the pairs
(A i . . .A k ), and Φ À and Φ + describe the corresponding exciton states. We refer for a
more detailed discussion to the chapter “Theoretical Background” of [181] and the
Appendix SI2 of [190].
Exciton splitting of molecules located in adjacent channels is too small for being
easily detected. This can be deduced from the data reported in Fig. 24 where we
show (left) the magnitude of the Davydov coupling strength β c and of the resulting
spectral shift (right) as a function of the distance R for representative values for the
oscillator strength f and for the electronic excitation energy ΔE. The red lines in this
Fig. 23 (a) Relative orientation of the ETDMs of the donor 1 and of the acceptor 2 located in a
neighboring channel. The center to center distance a between two adjacent ZL channels amounts to
1.84 nm. (b) Phase relation and energy level diagram, shown for ϕ ¼ 0. Left: Phase relation which
describes the interaction caused by the ETDM between the electronically excited state configurations A i Ã. . .A k and A i . . .A k Ã. (c) Energy level diagram showing the exciton splitting of two
chromophores caused by the configuration interaction due to the ETDM. This interaction naturally
causes only a splitting of electronically excited states and has no consequences on the ground state.
The different splitting of the excited state levels for ETDM oriented collinear and for those which
are parallel, as represented by means of double arrows, is due to the angle dependence of κ. The
allowed electronic transitions are indicated by the dotted arrows
Guests in Nanochannels of Zeolite L
45
ffiffiffiffiffiffiffi
f
ΔE
r
ð13Þ
From Eq. (13) we find, as an example, the length of the ETDM of an organic
molecule absorbing light at 500 nm with oscillator strength one to be 0.215 nm. This
means that the distance R between the ETDM of two adjacent molecules in a
nanochannel of interest here is usually large enough, so that Eq. (12) can be
considered as a good approximation. We show in Fig. 23 schematically different
orientations and packing of dye molecules in a 1D channel. The double arrows
indicate the direction of the ETDM of the first allowed electronic transition. The
inverse power to the third distance dependence of the coupling strength β c allows to
deduce that molecular engineering can be applied for fine-tuning the distance
between the chromophores, e.g., by covalently binding optically inert spacers at
the end of the chromophores as illustrated in Fig. 22. From Eq. (12) we know, e.g.,
that the value of β c decreases by a factor of 3.375 if the distance between two
interacting ETDM is augmented from 2/3R to R. This possibility for fine-tuning has
been tested for perylene dyes [16, 162]. The wave functions Ψ i Ψ k and Ψ
Ã
i Ψ k , Ψ i Ψ
Ã
k
in Fig. 23 describe the ground state and the electronically excited states of the pairs
(A i . . .A k ), and Φ À and Φ + describe the corresponding exciton states. We refer for a
more detailed discussion to the chapter “Theoretical Background” of [181] and the
Appendix SI2 of [190].
Exciton splitting of molecules located in adjacent channels is too small for being
easily detected. This can be deduced from the data reported in Fig. 24 where we
show (left) the magnitude of the Davydov coupling strength β c and of the resulting
spectral shift (right) as a function of the distance R for representative values for the
oscillator strength f and for the electronic excitation energy ΔE. The red lines in this
Fig. 23 (a) Relative orientation of the ETDMs of the donor 1 and of the acceptor 2 located in a
neighboring channel. The center to center distance a between two adjacent ZL channels amounts to
1.84 nm. (b) Phase relation and energy level diagram, shown for ϕ ¼ 0. Left: Phase relation which
describes the interaction caused by the ETDM between the electronically excited state configurations A i Ã. . .A k and A i . . .A k Ã. (c) Energy level diagram showing the exciton splitting of two
chromophores caused by the configuration interaction due to the ETDM. This interaction naturally
causes only a splitting of electronically excited states and has no consequences on the ground state.
The different splitting of the excited state levels for ETDM oriented collinear and for those which
are parallel, as represented by means of double arrows, is due to the angle dependence of κ. The
allowed electronic transitions are indicated by the dotted arrows
Guests in Nanochannels of Zeolite L
45