

(0.023, ε(415 nm) ¼ 4,000 M
À1 cm
À1 ), while the second one (S 2
S 0 ) is of high
intensity (0.19, ε(357 nm) ¼ 21,400 M
À1 cm
À1 ). Both corresponding ETDMs are in
the molecular plane perpendicular to each other, as explained in Fig. 16. In Me-Acr
+
-
ZL composites, both are located in a plane perpendicular to the channel axis
[154]. Polarized absorption and fluorescence properties have been investigated on
oriented MeAcr
+
-ZL monolayers [128]. These facts make Me-Acr
+ special, and it is
interesting to compare the absorption and the fluorescence spectra in aqueous
solution and in hydrated composites. We show the data in Fig. 18. The presence
of characteristic vibronic features in all spectra in solution and in the MeAcr
+
-ZL
composite is remarkable. They differ little and are equally present in the excitation
spectrum. Since the shifts in peak position between the spectra in these environments
are small, it is sufficient to indicate them by means of vertical lines for the aqueous
solution spectra. The same holds for the numerical values of the 0Àν
0 and the
0Àν
00 transitions and for the energy difference between the 0Àν
0 and the 0-(ν
0 + 1)
transitions ΔΕ[ν
0
À(ν
0 + 1)], and for the energy difference between the 0Àν
00 and the
0À(ν
00 + 1) transitions ΔΕ[ν
00
À(ν
00 + 1)] (Table 6). We observe that the vibrational
energies are all in the same range of about 1,200 cm
À1 . This means that all of them
are most probably related to aromatic C–H bending and/or C–C stretching vibrations. The nearly perfect mirror symmetry between the S 0 ! S 1 absorption and the
S 0
S 1 fluorescence bands, and the well-developed vibrational features, indicates
that there is very little difference between the shape of the potential energy curves of
the S 0 , the S 1 , and the S 2 states. This means that the minimum positions of the S 0 and
the S 2 potentials are about identical while that of the S 1 is slightly displaced with
respect to the previous two and that this holds similarly for Me-Acr
+ dissolved in
water and confined within the ZL nanochannels. The observations we have
presented for the perylene-ZL and for the MeAcr
+
-ZL composites reflect the properties of many dyes confined within the nanochannels of ZL. We refer to Fig. 11 of
[178], where a comparison of the absorption, fluorescence, and excitation spectra of
a 10
À6 M Ox
+ solution in MeOH and of Ox
+
-ZL composites measured using the
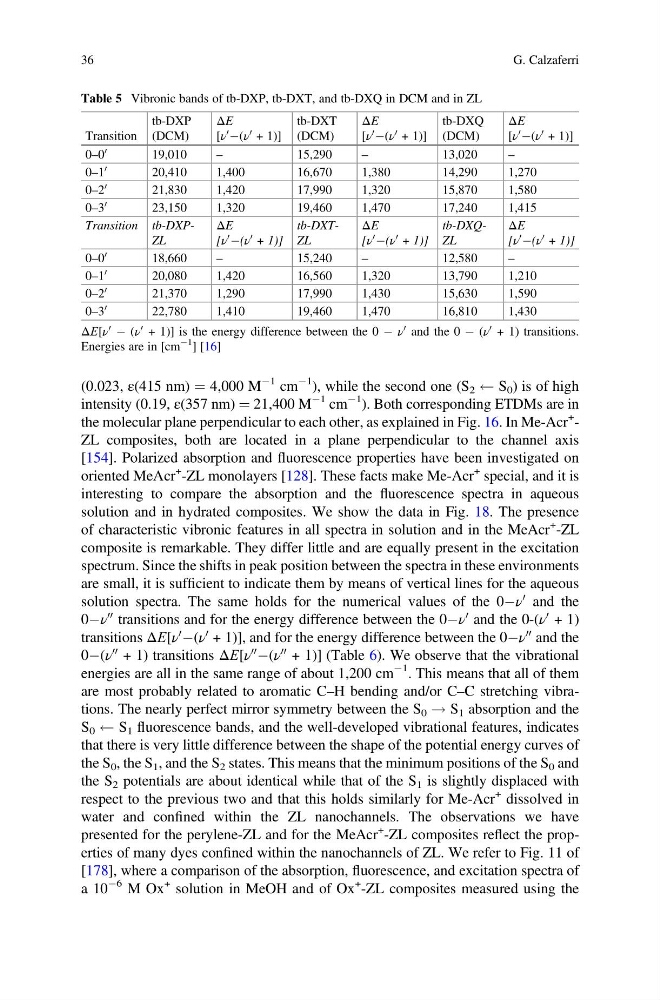
Table 5 Vibronic bands of tb-DXP, tb-DXT, and tb-DXQ in DCM and in ZL
Transition
tb-DXP
(DCM)
ΔE
[ν
0 À(ν
0 + 1)]
tb-DXT
(DCM)
ΔE
[ν
0 À(ν
0 + 1)]
tb-DXQ
(DCM)
ΔE
[ν
0 À(ν
0 + 1)]
0–0
0
19,010
–
15,290
–
13,020
–
0–1
0
20,410
1,400
16,670
1,380
14,290
1,270
0–2
0
21,830
1,420
17,990
1,320
15,870
1,580
0–3
0
23,150
1,320
19,460
1,470
17,240
1,415
Transition tb-DXPZL
ΔE
[ν
0 À(ν
0 + 1)]
tb-DXTZL
ΔE
[ν
0 À(ν
0 + 1)]
tb-DXQZL
ΔE
[ν
0 À(ν
0 + 1)]
0–0
0
18,660
–
15,240
–
12,580
–
0–1
0
20,080
1,420
16,560
1,320
13,790
1,210
0–2
0
21,370
1,290
17,990
1,430
15,630
1,590
0–3
0
22,780
1,410
19,460
1,470
16,810
1,430
ΔΕ[ν
0 À (ν
0 + 1)] is the energy difference between the 0 À ν
0 and the 0 À (ν
0 + 1) transitions.
Energies are in [cm
À1
] [16]
36
G. Calzaferri
À1 cm
À1 ), while the second one (S 2
S 0 ) is of high
intensity (0.19, ε(357 nm) ¼ 21,400 M
À1 cm
À1 ). Both corresponding ETDMs are in
the molecular plane perpendicular to each other, as explained in Fig. 16. In Me-Acr
+
-
ZL composites, both are located in a plane perpendicular to the channel axis
[154]. Polarized absorption and fluorescence properties have been investigated on
oriented MeAcr
+
-ZL monolayers [128]. These facts make Me-Acr
+ special, and it is
interesting to compare the absorption and the fluorescence spectra in aqueous
solution and in hydrated composites. We show the data in Fig. 18. The presence
of characteristic vibronic features in all spectra in solution and in the MeAcr
+
-ZL
composite is remarkable. They differ little and are equally present in the excitation
spectrum. Since the shifts in peak position between the spectra in these environments
are small, it is sufficient to indicate them by means of vertical lines for the aqueous
solution spectra. The same holds for the numerical values of the 0Àν
0 and the
0Àν
00 transitions and for the energy difference between the 0Àν
0 and the 0-(ν
0 + 1)
transitions ΔΕ[ν
0
À(ν
0 + 1)], and for the energy difference between the 0Àν
00 and the
0À(ν
00 + 1) transitions ΔΕ[ν
00
À(ν
00 + 1)] (Table 6). We observe that the vibrational
energies are all in the same range of about 1,200 cm
À1 . This means that all of them
are most probably related to aromatic C–H bending and/or C–C stretching vibrations. The nearly perfect mirror symmetry between the S 0 ! S 1 absorption and the
S 0
S 1 fluorescence bands, and the well-developed vibrational features, indicates
that there is very little difference between the shape of the potential energy curves of
the S 0 , the S 1 , and the S 2 states. This means that the minimum positions of the S 0 and
the S 2 potentials are about identical while that of the S 1 is slightly displaced with
respect to the previous two and that this holds similarly for Me-Acr
+ dissolved in
water and confined within the ZL nanochannels. The observations we have
presented for the perylene-ZL and for the MeAcr
+
-ZL composites reflect the properties of many dyes confined within the nanochannels of ZL. We refer to Fig. 11 of
[178], where a comparison of the absorption, fluorescence, and excitation spectra of
a 10
À6 M Ox
+ solution in MeOH and of Ox
+
-ZL composites measured using the
Table 5 Vibronic bands of tb-DXP, tb-DXT, and tb-DXQ in DCM and in ZL
Transition
tb-DXP
(DCM)
ΔE
[ν
0 À(ν
0 + 1)]
tb-DXT
(DCM)
ΔE
[ν
0 À(ν
0 + 1)]
tb-DXQ
(DCM)
ΔE
[ν
0 À(ν
0 + 1)]
0–0
0
19,010
–
15,290
–
13,020
–
0–1
0
20,410
1,400
16,670
1,380
14,290
1,270
0–2
0
21,830
1,420
17,990
1,320
15,870
1,580
0–3
0
23,150
1,320
19,460
1,470
17,240
1,415
Transition tb-DXPZL
ΔE
[ν
0 À(ν
0 + 1)]
tb-DXTZL
ΔE
[ν
0 À(ν
0 + 1)]
tb-DXQZL
ΔE
[ν
0 À(ν
0 + 1)]
0–0
0
18,660
–
15,240
–
12,580
–
0–1
0
20,080
1,420
16,560
1,320
13,790
1,210
0–2
0
21,370
1,290
17,990
1,430
15,630
1,590
0–3
0
22,780
1,410
19,460
1,470
16,810
1,430
ΔΕ[ν
0 À (ν
0 + 1)] is the energy difference between the 0 À ν
0 and the 0 À (ν
0 + 1) transitions.
Energies are in [cm
À1
] [16]
36
G. Calzaferri