

FRET efficiency is generally limited to intermolecular distances in the range of
5–10 nm and depends on the spectral overlap integral J (Eq. (7)). The efficiency of
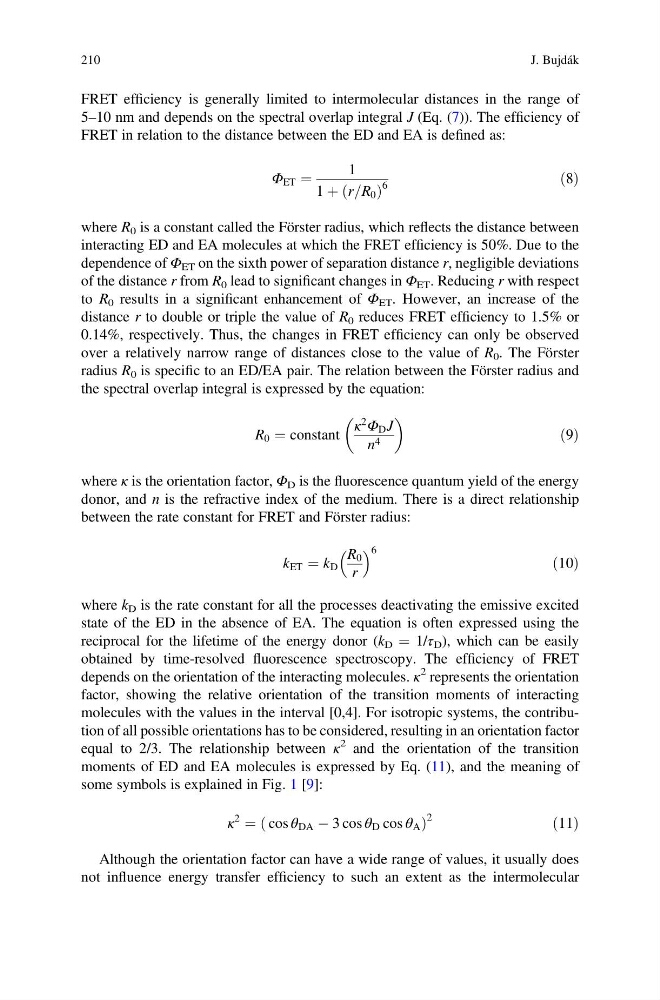
FRET in relation to the distance between the ED and EA is defined as:
Φ ET ¼
1
1 þ r=R 0
ð
Þ
6
ð8Þ
where R 0 is a constant called the Förster radius, which reflects the distance between
interacting ED and EA molecules at which the FRET efficiency is 50%. Due to the
dependence of Φ ET on the sixth power of separation distance r, negligible deviations
of the distance r from R 0 lead to significant changes in Φ ET . Reducing r with respect
to R 0 results in a significant enhancement of Φ ET . However, an increase of the
distance r to double or triple the value of R 0 reduces FRET efficiency to 1.5% or
0.14%, respectively. Thus, the changes in FRET efficiency can only be observed
over a relatively narrow range of distances close to the value of R 0 . The Förster
radius R 0 is specific to an ED/EA pair. The relation between the Förster radius and
the spectral overlap integral is expressed by the equation:
R 0 ¼ constant
κ
2
Φ D J
n 4
ð9Þ
where κ is the orientation factor, Φ D is the fluorescence quantum yield of the energy
donor, and n is the refractive index of the medium. There is a direct relationship
between the rate constant for FRET and Förster radius:
k ET ¼ k D
R 0
r
6
ð10Þ
where k D is the rate constant for all the processes deactivating the emissive excited
state of the ED in the absence of EA. The equation is often expressed using the
reciprocal for the lifetime of the energy donor (k D ¼ 1/τ D ), which can be easily
obtained by time-resolved fluorescence spectroscopy. The efficiency of FRET
depends on the orientation of the interacting molecules. κ
2 represents the orientation
factor, showing the relative orientation of the transition moments of interacting
molecules with the values in the interval [0,4]. For isotropic systems, the contribution of all possible orientations has to be considered, resulting in an orientation factor
equal to 2/3. The relationship between κ
2 and the orientation of the transition
moments of ED and EA molecules is expressed by Eq. (11), and the meaning of
some symbols is explained in Fig. 1 [9]:
κ
2
¼ cos θ DA À 3 cos θ D cos θ A
ð
Þ
2
ð11Þ
Although the orientation factor can have a wide range of values, it usually does
not influence energy transfer efficiency to such an extent as the intermolecular
210
J. Bujdák
5–10 nm and depends on the spectral overlap integral J (Eq. (7)). The efficiency of
FRET in relation to the distance between the ED and EA is defined as:
Φ ET ¼
1
1 þ r=R 0
ð
Þ
6
ð8Þ
where R 0 is a constant called the Förster radius, which reflects the distance between
interacting ED and EA molecules at which the FRET efficiency is 50%. Due to the
dependence of Φ ET on the sixth power of separation distance r, negligible deviations
of the distance r from R 0 lead to significant changes in Φ ET . Reducing r with respect
to R 0 results in a significant enhancement of Φ ET . However, an increase of the
distance r to double or triple the value of R 0 reduces FRET efficiency to 1.5% or
0.14%, respectively. Thus, the changes in FRET efficiency can only be observed
over a relatively narrow range of distances close to the value of R 0 . The Förster
radius R 0 is specific to an ED/EA pair. The relation between the Förster radius and
the spectral overlap integral is expressed by the equation:
R 0 ¼ constant
κ
2
Φ D J
n 4
ð9Þ
where κ is the orientation factor, Φ D is the fluorescence quantum yield of the energy
donor, and n is the refractive index of the medium. There is a direct relationship
between the rate constant for FRET and Förster radius:
k ET ¼ k D
R 0
r
6
ð10Þ
where k D is the rate constant for all the processes deactivating the emissive excited
state of the ED in the absence of EA. The equation is often expressed using the
reciprocal for the lifetime of the energy donor (k D ¼ 1/τ D ), which can be easily
obtained by time-resolved fluorescence spectroscopy. The efficiency of FRET
depends on the orientation of the interacting molecules. κ
2 represents the orientation
factor, showing the relative orientation of the transition moments of interacting
molecules with the values in the interval [0,4]. For isotropic systems, the contribution of all possible orientations has to be considered, resulting in an orientation factor
equal to 2/3. The relationship between κ
2 and the orientation of the transition
moments of ED and EA molecules is expressed by Eq. (11), and the meaning of
some symbols is explained in Fig. 1 [9]:
κ
2
¼ cos θ DA À 3 cos θ D cos θ A
ð
Þ
2
ð11Þ
Although the orientation factor can have a wide range of values, it usually does
not influence energy transfer efficiency to such an extent as the intermolecular
210
J. Bujdák