

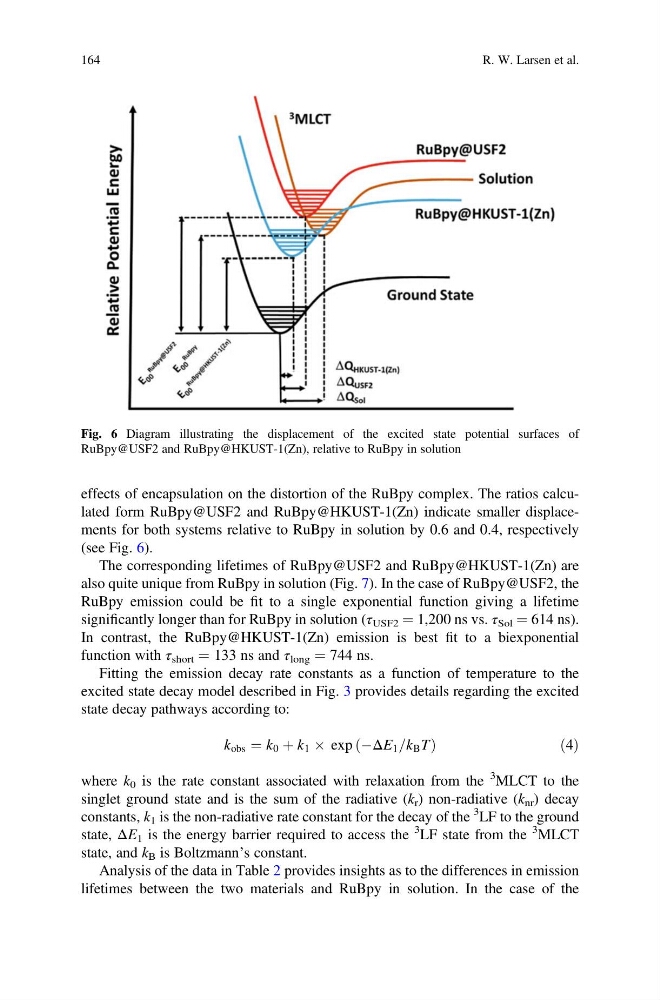
effects of encapsulation on the distortion of the RuBpy complex. The ratios calculated form RuBpy@USF2 and RuBpy@HKUST-1(Zn) indicate smaller displacements for both systems relative to RuBpy in solution by 0.6 and 0.4, respectively
(see Fig. 6).
The corresponding lifetimes of RuBpy@USF2 and RuBpy@HKUST-1(Zn) are
also quite unique from RuBpy in solution (Fig. 7). In the case of RuBpy@USF2, the
RuBpy emission could be fit to a single exponential function giving a lifetime
significantly longer than for RuBpy in solution (τ USF2 ¼ 1,200 ns vs. τ Sol ¼ 614 ns).
In contrast, the RuBpy@HKUST-1(Zn) emission is best fit to a biexponential
function with τ short ¼ 133 ns and τ long ¼ 744 ns.
Fitting the emission decay rate constants as a function of temperature to the
excited state decay model described in Fig. 3 provides details regarding the excited
state decay pathways according to:
k obs ¼ k 0 þ k 1 Â exp ÀΔE 1 =k B T
ð
Þ
ð 4Þ
where k 0 is the rate constant associated with relaxation from the
3 MLCT to the
singlet ground state and is the sum of the radiative (k r ) non-radiative (k nr ) decay
constants, k 1 is the non-radiative rate constant for the decay of the
3 LF to the ground
state, ΔE 1 is the energy barrier required to access the
3 LF state from the
3 MLCT
state, and k B is Boltzmann’s constant.
Analysis of the data in Table 2 provides insights as to the differences in emission
lifetimes between the two materials and RuBpy in solution. In the case of the
Fig. 6 Diagram illustrating the displacement of the excited state potential surfaces of
RuBpy@USF2 and RuBpy@HKUST-1(Zn), relative to RuBpy in solution
164
R. W. Larsen et al.
(see Fig. 6).
The corresponding lifetimes of RuBpy@USF2 and RuBpy@HKUST-1(Zn) are
also quite unique from RuBpy in solution (Fig. 7). In the case of RuBpy@USF2, the
RuBpy emission could be fit to a single exponential function giving a lifetime
significantly longer than for RuBpy in solution (τ USF2 ¼ 1,200 ns vs. τ Sol ¼ 614 ns).
In contrast, the RuBpy@HKUST-1(Zn) emission is best fit to a biexponential
function with τ short ¼ 133 ns and τ long ¼ 744 ns.
Fitting the emission decay rate constants as a function of temperature to the
excited state decay model described in Fig. 3 provides details regarding the excited
state decay pathways according to:
k obs ¼ k 0 þ k 1 Â exp ÀΔE 1 =k B T
ð
Þ
ð 4Þ
where k 0 is the rate constant associated with relaxation from the
3 MLCT to the
singlet ground state and is the sum of the radiative (k r ) non-radiative (k nr ) decay
constants, k 1 is the non-radiative rate constant for the decay of the
3 LF to the ground
state, ΔE 1 is the energy barrier required to access the
3 LF state from the
3 MLCT
state, and k B is Boltzmann’s constant.
Analysis of the data in Table 2 provides insights as to the differences in emission
lifetimes between the two materials and RuBpy in solution. In the case of the
Fig. 6 Diagram illustrating the displacement of the excited state potential surfaces of
RuBpy@USF2 and RuBpy@HKUST-1(Zn), relative to RuBpy in solution
164
R. W. Larsen et al.