

– Sensitivity
– Detection and quantitative limits
• Selectivity/specificity
• Reliability
• Regeneration
• Repeatability/reproducibility
• Stability
In the following, every criterion will be explained in more detail.
For the development of a biosensor, the immobilization of the recognition
element has to be validated. During this validation, it would be useful to determine
the number of immobilized recognition elements and if possible the capture
capacity which is the ratio of active to immobilized recognition elements. The
number of immobilized recognition elements should be normalized to the unit of
area, e.g., molecules per cm
2 , whereas the capture capacity should be expressed
in percentage. With these values, it is possible to evaluate the efficiency of the
immobilization procedure and to determine which concentration range should
be used for the calibration curve.
The time passed until the signal reached 90% of the maximal response R max
is called the steady-state response time. This parameter depends mainly on the
diffusion of the analyte, the affinity of the aptamer, and if the sample is stirred.
The calibration curve should be obtained from steady-state responses close to
equilibrium, because these are unaffected by diffusion rates and analyte
reassociation. The measurement time should be kept constant for every of
the minimum of six freshly prepared analyte concentrations used, and each
concentration should be repeated at least three times. The sample matrix should
be adjusted to the final application of the developed biosensor. And most important
is that the authors clearly specify the measurement procedure including the
washing steps, the composition of the samples used, and how the reproducibility
was determined. The calibration curve should be displayed as scatter plot of the
signal versus logarithm of the analyte concentration including the standard deviation
of the repeated measurements for every concentration. For better comparison of
electrochemical biosensors, we suggest that the signal measured is normalized to
the signal of a blank sample and to the electroactive electrode surface area.
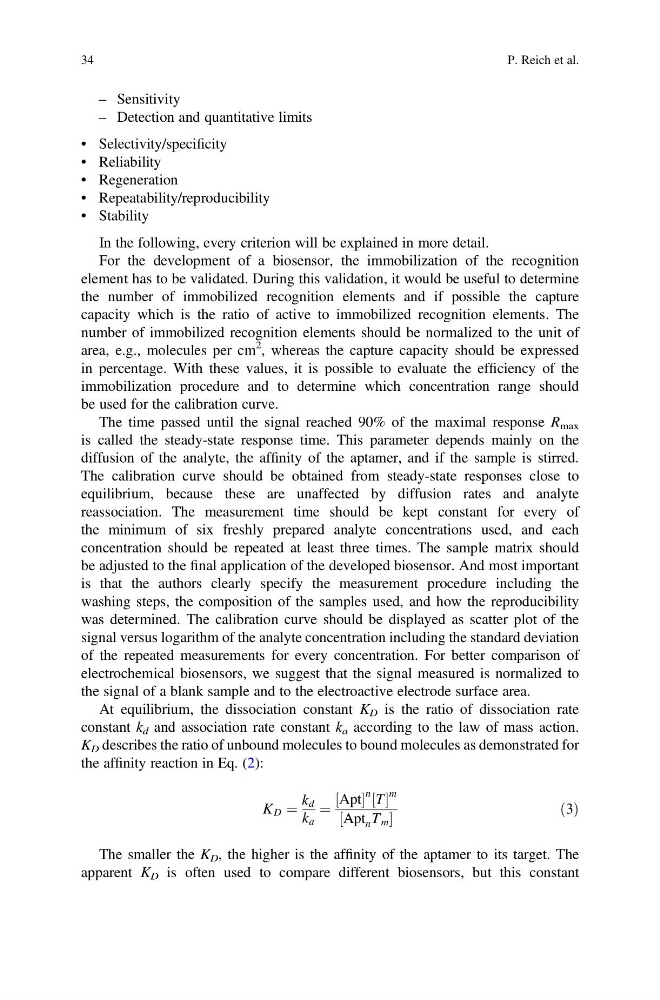
At equilibrium, the dissociation constant K D is the ratio of dissociation rate
constant k d and association rate constant k a according to the law of mass action.
K D describes the ratio of unbound molecules to bound molecules as demonstrated for
the affinity reaction in Eq. (2):
K D ¼
k d
k a
¼
Apt
½
n T
½
m
Apt n T m
½
ð3Þ
The smaller the K D , the higher is the affinity of the aptamer to its target. The
apparent K D is often used to compare different biosensors, but this constant
34
P. Reich et al.
– Detection and quantitative limits
• Selectivity/specificity
• Reliability
• Regeneration
• Repeatability/reproducibility
• Stability
In the following, every criterion will be explained in more detail.
For the development of a biosensor, the immobilization of the recognition
element has to be validated. During this validation, it would be useful to determine
the number of immobilized recognition elements and if possible the capture
capacity which is the ratio of active to immobilized recognition elements. The
number of immobilized recognition elements should be normalized to the unit of
area, e.g., molecules per cm
2 , whereas the capture capacity should be expressed
in percentage. With these values, it is possible to evaluate the efficiency of the
immobilization procedure and to determine which concentration range should
be used for the calibration curve.
The time passed until the signal reached 90% of the maximal response R max
is called the steady-state response time. This parameter depends mainly on the
diffusion of the analyte, the affinity of the aptamer, and if the sample is stirred.
The calibration curve should be obtained from steady-state responses close to
equilibrium, because these are unaffected by diffusion rates and analyte
reassociation. The measurement time should be kept constant for every of
the minimum of six freshly prepared analyte concentrations used, and each
concentration should be repeated at least three times. The sample matrix should
be adjusted to the final application of the developed biosensor. And most important
is that the authors clearly specify the measurement procedure including the
washing steps, the composition of the samples used, and how the reproducibility
was determined. The calibration curve should be displayed as scatter plot of the
signal versus logarithm of the analyte concentration including the standard deviation
of the repeated measurements for every concentration. For better comparison of
electrochemical biosensors, we suggest that the signal measured is normalized to
the signal of a blank sample and to the electroactive electrode surface area.
At equilibrium, the dissociation constant K D is the ratio of dissociation rate
constant k d and association rate constant k a according to the law of mass action.
K D describes the ratio of unbound molecules to bound molecules as demonstrated for
the affinity reaction in Eq. (2):
K D ¼
k d
k a
¼
Apt
½
n T
½
m
Apt n T m
½
ð3Þ
The smaller the K D , the higher is the affinity of the aptamer to its target. The
apparent K D is often used to compare different biosensors, but this constant
34
P. Reich et al.