

is strongly dependent on the measurement method and measurement conditions like
temperature, pH, ionic strength, flow rate, etc. Therefore, we recommend that it
should only be used to compare different molecules measured with the same method
under the same conditions or to compare the same molecule measured with different
methods or different conditions. Besides, the conditions of the measurement should
be considered carefully and stated clearly, because limitations to the binding of
aptamer and target will lead to inaccurate affinity rate constants. For example, if the
diffusion rate is slower than the association rate, then the limiting mass transfer will
result in a decrease of the rate constants. K D also depends strongly on the number of
immobilized and/or active recognition elements; thus this should be stated.
From the obtained calibration curve, many parameters can be determined.
K D corresponds to the concentration that is equivalent to a response that is 50% of
the maximum response R max . It can be determined by fitting the curve with a binding
site model. As differences appear due to the application of different models, we
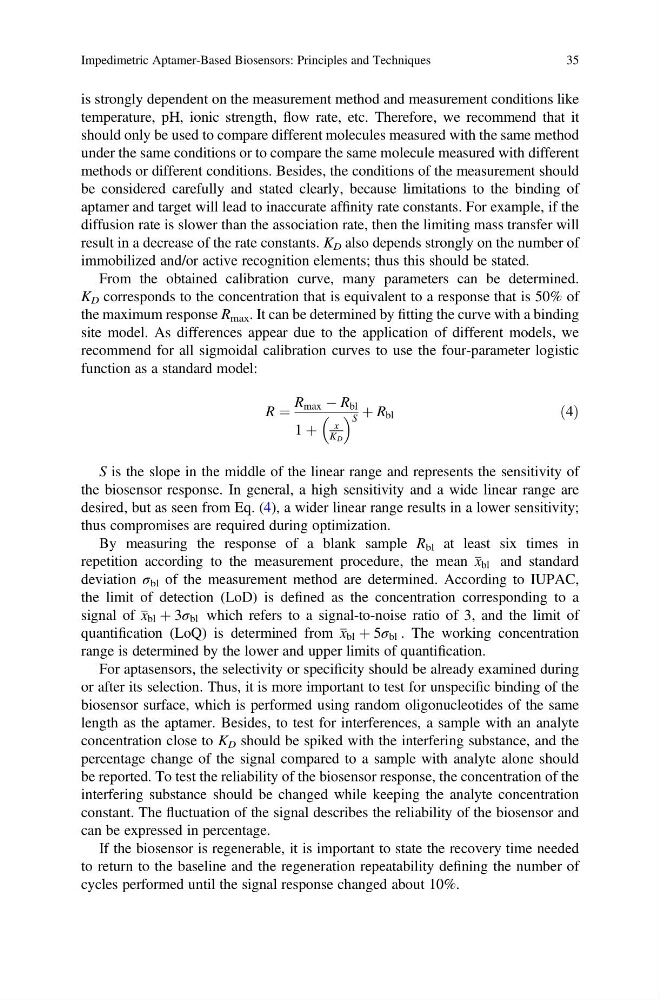
recommend for all sigmoidal calibration curves to use the four-parameter logistic
function as a standard model:
R ¼
R max À R bl
1 þ
x
K D
S þ R bl
ð4Þ
S is the slope in the middle of the linear range and represents the sensitivity of
the biosensor response. In general, a high sensitivity and a wide linear range are
desired, but as seen from Eq. (4), a wider linear range results in a lower sensitivity;
thus compromises are required during optimization.
By measuring the response of a blank sample R bl at least six times in
repetition according to the measurement procedure, the mean x bl and standard
deviation σ bl of the measurement method are determined. According to IUPAC,
the limit of detection (LoD) is defined as the concentration corresponding to a
signal of x bl þ 3σ bl which refers to a signal-to-noise ratio of 3, and the limit of
quantification (LoQ) is determined from x bl þ 5σ bl . The working concentration
range is determined by the lower and upper limits of quantification.
For aptasensors, the selectivity or specificity should be already examined during
or after its selection. Thus, it is more important to test for unspecific binding of the
biosensor surface, which is performed using random oligonucleotides of the same
length as the aptamer. Besides, to test for interferences, a sample with an analyte
concentration close to K D should be spiked with the interfering substance, and the
percentage change of the signal compared to a sample with analyte alone should
be reported. To test the reliability of the biosensor response, the concentration of the
interfering substance should be changed while keeping the analyte concentration
constant. The fluctuation of the signal describes the reliability of the biosensor and
can be expressed in percentage.
If the biosensor is regenerable, it is important to state the recovery time needed
to return to the baseline and the regeneration repeatability defining the number of
cycles performed until the signal response changed about 10%.
Impedimetric Aptamer-Based Biosensors: Principles and Techniques
35
temperature, pH, ionic strength, flow rate, etc. Therefore, we recommend that it
should only be used to compare different molecules measured with the same method
under the same conditions or to compare the same molecule measured with different
methods or different conditions. Besides, the conditions of the measurement should
be considered carefully and stated clearly, because limitations to the binding of
aptamer and target will lead to inaccurate affinity rate constants. For example, if the
diffusion rate is slower than the association rate, then the limiting mass transfer will
result in a decrease of the rate constants. K D also depends strongly on the number of
immobilized and/or active recognition elements; thus this should be stated.
From the obtained calibration curve, many parameters can be determined.
K D corresponds to the concentration that is equivalent to a response that is 50% of
the maximum response R max . It can be determined by fitting the curve with a binding
site model. As differences appear due to the application of different models, we
recommend for all sigmoidal calibration curves to use the four-parameter logistic
function as a standard model:
R ¼
R max À R bl
1 þ
x
K D
S þ R bl
ð4Þ
S is the slope in the middle of the linear range and represents the sensitivity of
the biosensor response. In general, a high sensitivity and a wide linear range are
desired, but as seen from Eq. (4), a wider linear range results in a lower sensitivity;
thus compromises are required during optimization.
By measuring the response of a blank sample R bl at least six times in
repetition according to the measurement procedure, the mean x bl and standard
deviation σ bl of the measurement method are determined. According to IUPAC,
the limit of detection (LoD) is defined as the concentration corresponding to a
signal of x bl þ 3σ bl which refers to a signal-to-noise ratio of 3, and the limit of
quantification (LoQ) is determined from x bl þ 5σ bl . The working concentration
range is determined by the lower and upper limits of quantification.
For aptasensors, the selectivity or specificity should be already examined during
or after its selection. Thus, it is more important to test for unspecific binding of the
biosensor surface, which is performed using random oligonucleotides of the same
length as the aptamer. Besides, to test for interferences, a sample with an analyte
concentration close to K D should be spiked with the interfering substance, and the
percentage change of the signal compared to a sample with analyte alone should
be reported. To test the reliability of the biosensor response, the concentration of the
interfering substance should be changed while keeping the analyte concentration
constant. The fluctuation of the signal describes the reliability of the biosensor and
can be expressed in percentage.
If the biosensor is regenerable, it is important to state the recovery time needed
to return to the baseline and the regeneration repeatability defining the number of
cycles performed until the signal response changed about 10%.
Impedimetric Aptamer-Based Biosensors: Principles and Techniques
35