

3 Analysis of Population Structure
61
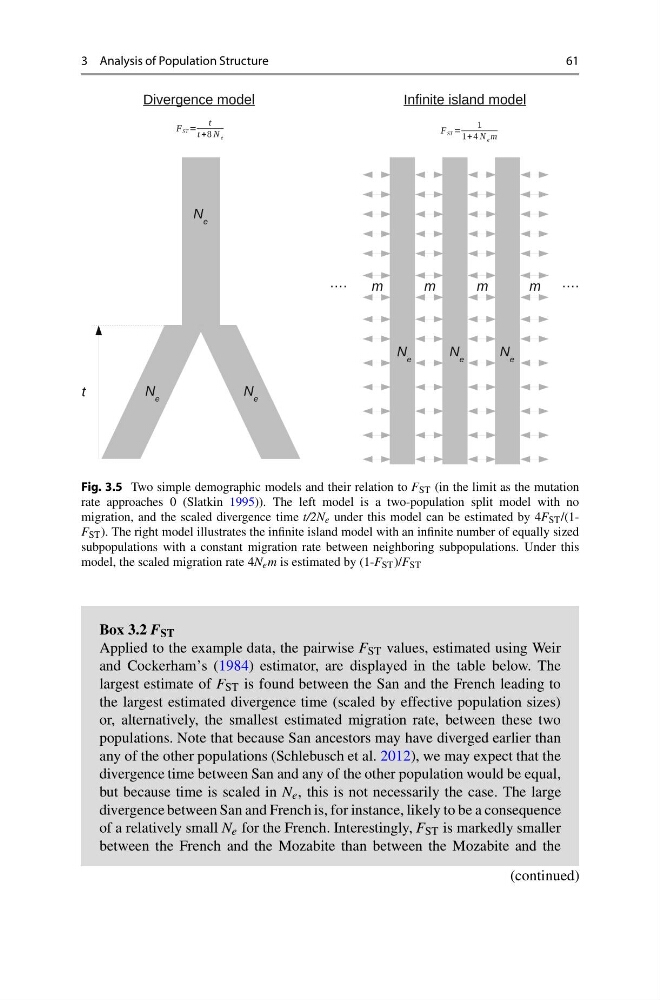
Fig. 3.5 Two simple demographic models and their relation to F ST (in the limit as the mutation
rate approaches 0 (Slatkin 1995)). The left model is a two-population split model with no
migration, and the scaled divergence time t/2N e under this model can be estimated by 4F ST /(1F ST ). The right model illustrates the infinite island model with an infinite number of equally sized
subpopulations with a constant migration rate between neighboring subpopulations. Under this
model, the scaled migration rate 4N e m is estimated by (1-F ST )/F ST
Box 3.2 F ST
Applied to the example data, the pairwise F ST values, estimated using Weir
and Cockerham’s (1984) estimator, are displayed in the table below. The
largest estimate of F ST is found between the San and the French leading to
the largest estimated divergence time (scaled by effective population sizes)
or, alternatively, the smallest estimated migration rate, between these two
populations. Note that because San ancestors may have diverged earlier than
any of the other populations (Schlebusch et al. 2012), we may expect that the
divergence time between San and any of the other population would be equal,
but because time is scaled in N e , this is not necessarily the case. The large
divergence between San and French is, for instance, likely to be a consequence
of a relatively small N e for the French. Interestingly, F ST is markedly smaller
between the French and the Mozabite than between the Mozabite and the
(continued)
61
Fig. 3.5 Two simple demographic models and their relation to F ST (in the limit as the mutation
rate approaches 0 (Slatkin 1995)). The left model is a two-population split model with no
migration, and the scaled divergence time t/2N e under this model can be estimated by 4F ST /(1F ST ). The right model illustrates the infinite island model with an infinite number of equally sized
subpopulations with a constant migration rate between neighboring subpopulations. Under this
model, the scaled migration rate 4N e m is estimated by (1-F ST )/F ST
Box 3.2 F ST
Applied to the example data, the pairwise F ST values, estimated using Weir
and Cockerham’s (1984) estimator, are displayed in the table below. The
largest estimate of F ST is found between the San and the French leading to
the largest estimated divergence time (scaled by effective population sizes)
or, alternatively, the smallest estimated migration rate, between these two
populations. Note that because San ancestors may have diverged earlier than
any of the other populations (Schlebusch et al. 2012), we may expect that the
divergence time between San and any of the other population would be equal,
but because time is scaled in N e , this is not necessarily the case. The large
divergence between San and French is, for instance, likely to be a consequence
of a relatively small N e for the French. Interestingly, F ST is markedly smaller
between the French and the Mozabite than between the Mozabite and the
(continued)