

Sequenced PRB for the Pretreatment of Nitrate and Remediation of TCE
129
TCE concentration (mg/L)
0.2
0
0.6
0.4
1
12
0.8
Jul-10
Nov-10
Feb-11
Jun-11
Dec-11
Mar-12
Jun-12
Sep-12
MWG107B MWG101B MWG112B MWG104B MWG110B
Upgradient Denit. PRB
between
ZVI PRB Downgradient
Monitoring well
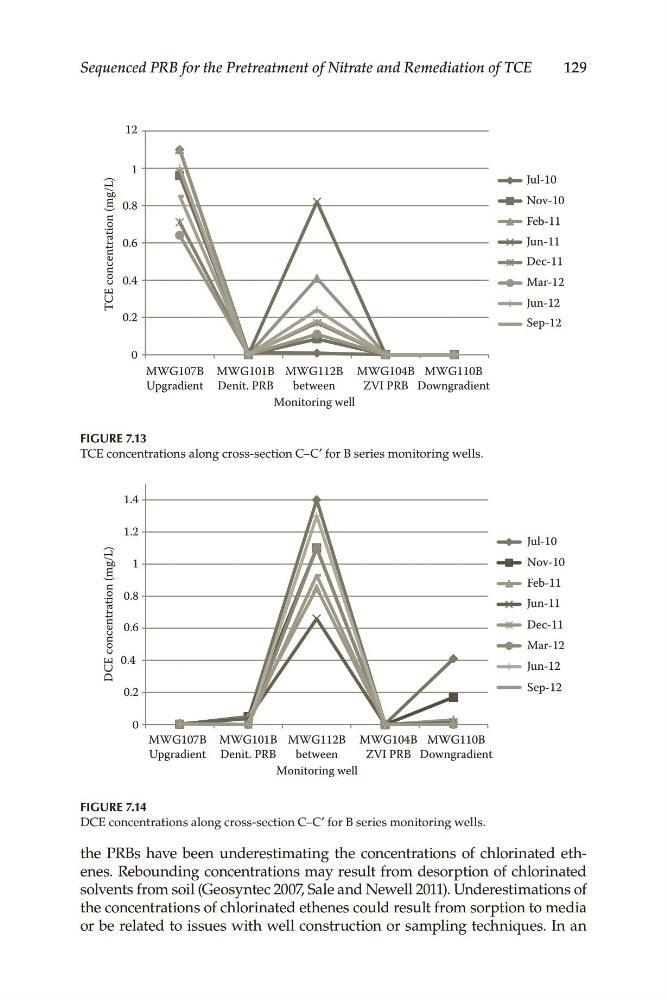
FIGURE 7.13
TCE concentrations along cross-section C–C′ for B series monitoring wells.
DCE concentration (mg/L)
0.4
0.2
0
0.8
0.6
1.2
1.4
1
Jul-10
Nov-10
Feb-11
Jun-11
Dec-11
Mar-12
Jun-12
Sep-12
MWG107B MWG101B MWG112B MWG104B MWG110B
Upgradient Denit. PRB
between
ZVI PRB Downgradient
Monitoring well
FIGURE 7.14
DCE concentrations along cross-section C–C′ for B series monitoring wells.
the PRBs have been underestimating the concentrations of chlorinated ethenes. Rebounding concentrations may result from desorption of chlorinated
solvents from soil (Geosyntec 2007, Sale and Newell 2011). Underestimations of
the concentrations of chlorinated ethenes could result from sorption to media
or be related to issues with well construction or sampling techniques. In an
129
TCE concentration (mg/L)
0.2
0
0.6
0.4
1
12
0.8
Jul-10
Nov-10
Feb-11
Jun-11
Dec-11
Mar-12
Jun-12
Sep-12
MWG107B MWG101B MWG112B MWG104B MWG110B
Upgradient Denit. PRB
between
ZVI PRB Downgradient
Monitoring well
FIGURE 7.13
TCE concentrations along cross-section C–C′ for B series monitoring wells.
DCE concentration (mg/L)
0.4
0.2
0
0.8
0.6
1.2
1.4
1
Jul-10
Nov-10
Feb-11
Jun-11
Dec-11
Mar-12
Jun-12
Sep-12
MWG107B MWG101B MWG112B MWG104B MWG110B
Upgradient Denit. PRB
between
ZVI PRB Downgradient
Monitoring well
FIGURE 7.14
DCE concentrations along cross-section C–C′ for B series monitoring wells.
the PRBs have been underestimating the concentrations of chlorinated ethenes. Rebounding concentrations may result from desorption of chlorinated
solvents from soil (Geosyntec 2007, Sale and Newell 2011). Underestimations of
the concentrations of chlorinated ethenes could result from sorption to media
or be related to issues with well construction or sampling techniques. In an