

128
Permeable Reactive Barrier
Nitrate (as N) (mg/L)
12
10
8
6
4
2
0
Jul-10
Nov-10
Feb-11
Jun-11
Dec-12
Mar-12
Jun-12
Sep-12
MWG107B MWG101B MWG112B MWG104B MWG110B
Upgradient Denit. PRB between
ZVI PRB Downgradient
Monitoring well
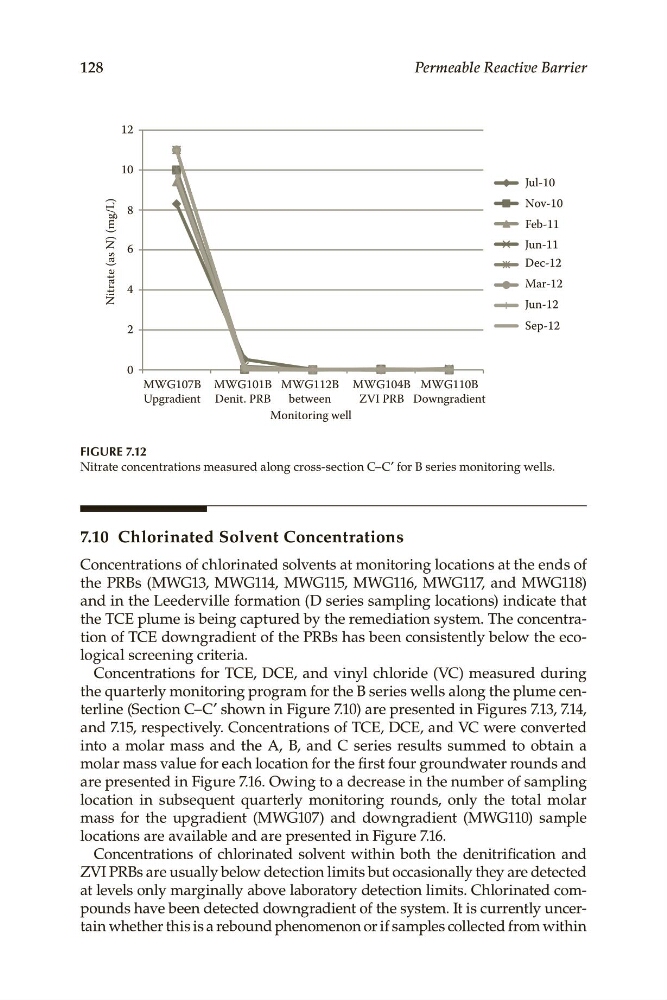
FIGURE 7.12
Nitrate concentrations measured along cross-section C–C′ for B series monitoring wells.
7.10 Chlorinated Solvent Concentrations
Concentrations of chlorinated solvents at monitoring locations at the ends of
the PRBs (MWG13, MWG114, MWG115, MWG116, MWG117, and MWG118)
and in the Leederville formation (D series sampling locations) indicate that
the TCE plume is being captured by the remediation system. The concentration of TCE downgradient of the PRBs has been consistently below the ecological screening criteria.
Concentrations for TCE, DCE, and vinyl chloride (VC) measured during
the quarterly monitoring program for the B series wells along the plume centerline (Section C–C′ shown in Figure 7.10) are presented in Figures 7.13, 7.14,
and 7.15, respectively. Concentrations of TCE, DCE, and VC were converted
into a molar mass and the A, B, and C series results summed to obtain a
molar mass value for each location for the first four groundwater rounds and
are presented in Figure 7.16. Owing to a decrease in the number of sampling
location in subsequent quarterly monitoring rounds, only the total molar
mass for the upgradient (MWG107) and downgradient (MWG110) sample
locations are available and are presented in Figure 7.16.
Concentrations of chlorinated solvent within both the denitrification and
ZVI PRBs are usually below detection limits but occasionally they are detected
at levels only marginally above laboratory detection limits. Chlorinated compounds have been detected downgradient of the system. It is currently uncertain whether this is a rebound phenomenon or if samples collected from within
Permeable Reactive Barrier
Nitrate (as N) (mg/L)
12
10
8
6
4
2
0
Jul-10
Nov-10
Feb-11
Jun-11
Dec-12
Mar-12
Jun-12
Sep-12
MWG107B MWG101B MWG112B MWG104B MWG110B
Upgradient Denit. PRB between
ZVI PRB Downgradient
Monitoring well
FIGURE 7.12
Nitrate concentrations measured along cross-section C–C′ for B series monitoring wells.
7.10 Chlorinated Solvent Concentrations
Concentrations of chlorinated solvents at monitoring locations at the ends of
the PRBs (MWG13, MWG114, MWG115, MWG116, MWG117, and MWG118)
and in the Leederville formation (D series sampling locations) indicate that
the TCE plume is being captured by the remediation system. The concentration of TCE downgradient of the PRBs has been consistently below the ecological screening criteria.
Concentrations for TCE, DCE, and vinyl chloride (VC) measured during
the quarterly monitoring program for the B series wells along the plume centerline (Section C–C′ shown in Figure 7.10) are presented in Figures 7.13, 7.14,
and 7.15, respectively. Concentrations of TCE, DCE, and VC were converted
into a molar mass and the A, B, and C series results summed to obtain a
molar mass value for each location for the first four groundwater rounds and
are presented in Figure 7.16. Owing to a decrease in the number of sampling
location in subsequent quarterly monitoring rounds, only the total molar
mass for the upgradient (MWG107) and downgradient (MWG110) sample
locations are available and are presented in Figure 7.16.
Concentrations of chlorinated solvent within both the denitrification and
ZVI PRBs are usually below detection limits but occasionally they are detected
at levels only marginally above laboratory detection limits. Chlorinated compounds have been detected downgradient of the system. It is currently uncertain whether this is a rebound phenomenon or if samples collected from within