

130
Permeable Reactive Barrier
VC concentration(mg/L)
0.05
0
0.15
0.1
0.25
0.3
0.2
Jul-10
Nov-10
Feb-11
Jun-11
Dec-11
Mar-12
Jun-12
Sep-12
MWG107B MWG101B MWG112B MWG104B MWG110B
Upgradient Denit. PRB
between
ZVI PRB Downgradient
Monitoring well
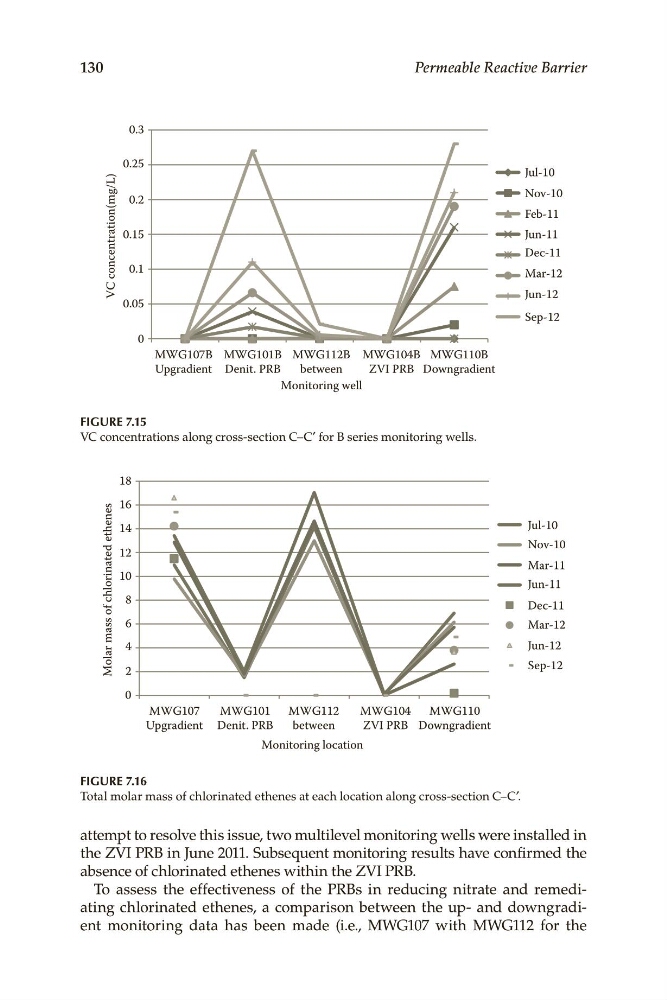
FIGURE 7.15
VC concentrations along cross-section C–C′ for B series monitoring wells.
Molar mass of chlorinated ethenes
12
10
8
6
4
2
0
14
16
18
Jul-10
Nov-10
Mar-11
Jun-11
Dec-11
Mar-12
Jun-12
Sep-12
MWG107
MWG101 MWG112
MWG104
MWG110
Upgradient Denit. PRB
between
ZVI PRB Downgradient
Monitoring location
FIGURE 7.16
Total molar mass of chlorinated ethenes at each location along cross-section C–C′.
attempt to resolve this issue, two multilevel monitoring wells were installed in
the ZVI PRB in June 2011. Subsequent monitoring results have confirmed the
absence of chlorinated ethenes within the ZVI PRB.
To assess the effectiveness of the PRBs in reducing nitrate and remediating chlorinated ethenes, a comparison between the up- and downgradient monitoring data has been made (i.e., MWG107 with MWG112 for the
Permeable Reactive Barrier
VC concentration(mg/L)
0.05
0
0.15
0.1
0.25
0.3
0.2
Jul-10
Nov-10
Feb-11
Jun-11
Dec-11
Mar-12
Jun-12
Sep-12
MWG107B MWG101B MWG112B MWG104B MWG110B
Upgradient Denit. PRB
between
ZVI PRB Downgradient
Monitoring well
FIGURE 7.15
VC concentrations along cross-section C–C′ for B series monitoring wells.
Molar mass of chlorinated ethenes
12
10
8
6
4
2
0
14
16
18
Jul-10
Nov-10
Mar-11
Jun-11
Dec-11
Mar-12
Jun-12
Sep-12
MWG107
MWG101 MWG112
MWG104
MWG110
Upgradient Denit. PRB
between
ZVI PRB Downgradient
Monitoring location
FIGURE 7.16
Total molar mass of chlorinated ethenes at each location along cross-section C–C′.
attempt to resolve this issue, two multilevel monitoring wells were installed in
the ZVI PRB in June 2011. Subsequent monitoring results have confirmed the
absence of chlorinated ethenes within the ZVI PRB.
To assess the effectiveness of the PRBs in reducing nitrate and remediating chlorinated ethenes, a comparison between the up- and downgradient monitoring data has been made (i.e., MWG107 with MWG112 for the