

Vibro compaction of granular soils 79
It is also very important that all pore water pressure increases created
by the vibratory motion in the treated soil are allowed to fully dissipate
before any postcompaction testing commences. Full relief of the excess
pore water pressure in the soil has normally occurred about one week after
compaction. In cases of doubt, it is better to wait for a longer period or to
measure the pore water pressure development over time directly. To avoid
any adverse influence on the postcompaction testing, this criterion should
be adhered to for a zone of about 30 m around the testing area where no
simultaneous compaction work should be carried out.
In special, not yet fully understood, circumstances, a so-called aging effect
can occur in sand whereby the strength properties of the compacted sand
continue to increase significantly for up to several weeks after compaction
(Mitchell et al., 1984; Massarsch, 1991; Schmertmann, 1991). It is therefore
recommended to perform field trials at the beginning of larger projects with
in-situ testing to start at different time intervals after compaction. By this way,
the significance of any potential time effect on the posttreatment test results
can be assessed, and the appropriate conclusions may be drawn. Increases in
cone resistance q c of up to 100% have been reported 10 weeks after the first
postcompaction test performed one week after completion of deep compaction.
According to an analysis made by Charlie et al. (1992, from Lunne et al.,
1997), covering projects that represent a wide range of geological and climatic conditions, the variation of the cone resistance q c with time can be
expressed by an empirical relationship as follows:
( )
(
) ( )
q
K N q
c N
c
log
= +
1
1
(3.28)
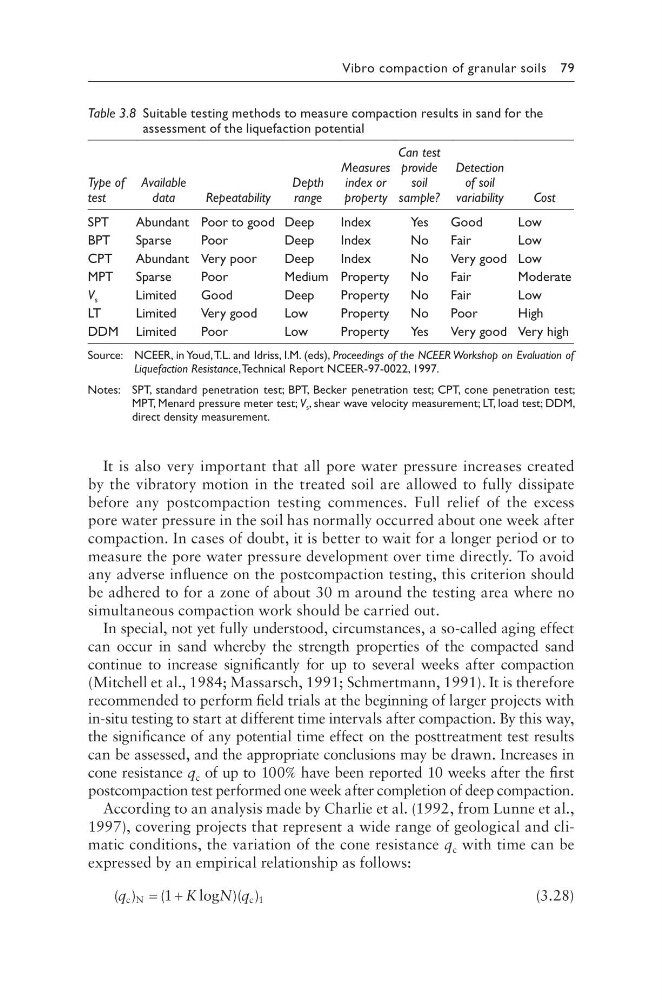
Table 3.8 Suitable testing methods to measure compaction results in sand for the
assessment of the liquefaction potential
Type of
test
Available
data
Repeatability
Depth
range
Measures
index or
property
Can test
provide
soil
sample?
Detection
of soil
variability
Cost
SPT
Abundant Poor to good Deep
Index
Yes
Good
Low
BPT
Sparse
Poor
Deep
Index
No
Fair
Low
CPT
Abundant Very poor
Deep
Index
No
Very good Low
MPT
Sparse
Poor
Medium Property
No
Fair
Moderate
V s
Limited
Good
Deep
Property
No
Fair
Low
LT
Limited
Very good
Low
Property
No
Poor
High
DDM Limited
Poor
Low
Property
Yes
Very good Very high
Source: NCEER, in Youd, T.L. and Idriss, I.M. (eds), Proceedings of the NCEER Workshop on Evaluation of
Liquefaction Resistance, Technical Report NCEER-97-0022, 1997.
Notes: SPT, standard penetration test; BPT, Becker penetration test; CPT, cone penetration test;
MPT, Menard pressure meter test; V s , shear wave velocity measurement; LT, load test; DDM,
direct density measurement.
It is also very important that all pore water pressure increases created
by the vibratory motion in the treated soil are allowed to fully dissipate
before any postcompaction testing commences. Full relief of the excess
pore water pressure in the soil has normally occurred about one week after
compaction. In cases of doubt, it is better to wait for a longer period or to
measure the pore water pressure development over time directly. To avoid
any adverse influence on the postcompaction testing, this criterion should
be adhered to for a zone of about 30 m around the testing area where no
simultaneous compaction work should be carried out.
In special, not yet fully understood, circumstances, a so-called aging effect
can occur in sand whereby the strength properties of the compacted sand
continue to increase significantly for up to several weeks after compaction
(Mitchell et al., 1984; Massarsch, 1991; Schmertmann, 1991). It is therefore
recommended to perform field trials at the beginning of larger projects with
in-situ testing to start at different time intervals after compaction. By this way,
the significance of any potential time effect on the posttreatment test results
can be assessed, and the appropriate conclusions may be drawn. Increases in
cone resistance q c of up to 100% have been reported 10 weeks after the first
postcompaction test performed one week after completion of deep compaction.
According to an analysis made by Charlie et al. (1992, from Lunne et al.,
1997), covering projects that represent a wide range of geological and climatic conditions, the variation of the cone resistance q c with time can be
expressed by an empirical relationship as follows:
( )
(
) ( )
q
K N q
c N
c
log
= +
1
1
(3.28)
Table 3.8 Suitable testing methods to measure compaction results in sand for the
assessment of the liquefaction potential
Type of
test
Available
data
Repeatability
Depth
range
Measures
index or
property
Can test
provide
soil
sample?
Detection
of soil
variability
Cost
SPT
Abundant Poor to good Deep
Index
Yes
Good
Low
BPT
Sparse
Poor
Deep
Index
No
Fair
Low
CPT
Abundant Very poor
Deep
Index
No
Very good Low
MPT
Sparse
Poor
Medium Property
No
Fair
Moderate
V s
Limited
Good
Deep
Property
No
Fair
Low
LT
Limited
Very good
Low
Property
No
Poor
High
DDM Limited
Poor
Low
Property
Yes
Very good Very high
Source: NCEER, in Youd, T.L. and Idriss, I.M. (eds), Proceedings of the NCEER Workshop on Evaluation of
Liquefaction Resistance, Technical Report NCEER-97-0022, 1997.
Notes: SPT, standard penetration test; BPT, Becker penetration test; CPT, cone penetration test;
MPT, Menard pressure meter test; V s , shear wave velocity measurement; LT, load test; DDM,
direct density measurement.