

Fig. 14.9 Mean annual
height growth rate
(AHGR) at the eighth year
for El Siambón and La
Fronterita trials for the
main species analyzed in
both trials. Standard errors
are presented. Means with
different letters are
significantly different
(p > 0.05). (Grignola, data
not published)
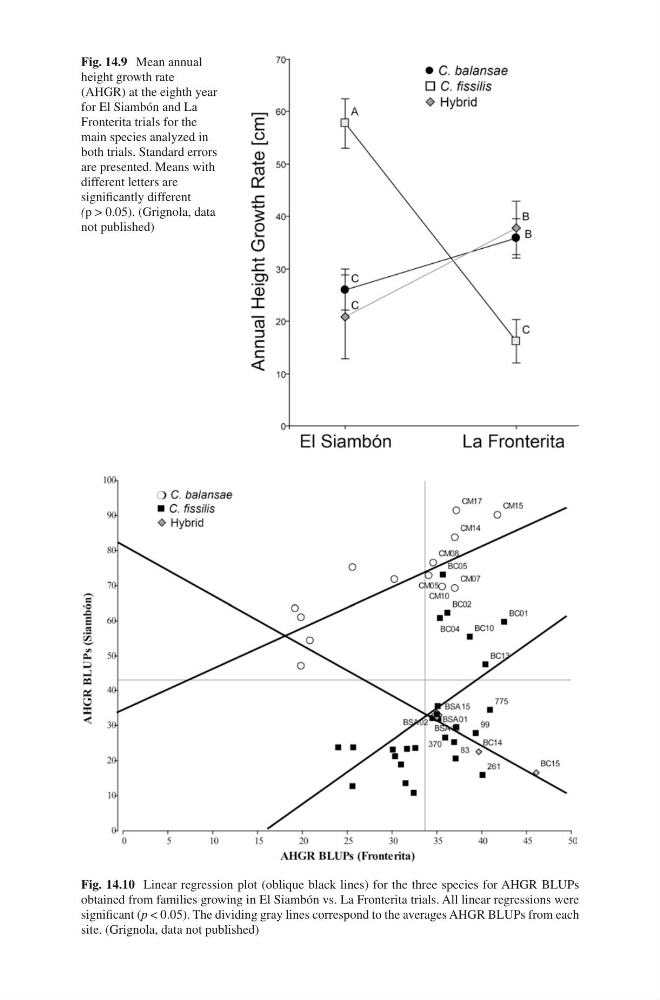
Fig. 14.10 Linear regression plot (oblique black lines) for the three species for AHGR BLUPs
obtained from families growing in El Siambón vs. La Fronterita trials. All linear regressions were
significant (p < 0.05). The dividing gray lines correspond to the averages AHGR BLUPs from each
site. (Grignola, data not published)
height growth rate
(AHGR) at the eighth year
for El Siambón and La
Fronterita trials for the
main species analyzed in
both trials. Standard errors
are presented. Means with
different letters are
significantly different
(p > 0.05). (Grignola, data
not published)
Fig. 14.10 Linear regression plot (oblique black lines) for the three species for AHGR BLUPs
obtained from families growing in El Siambón vs. La Fronterita trials. All linear regressions were
significant (p < 0.05). The dividing gray lines correspond to the averages AHGR BLUPs from each
site. (Grignola, data not published)