

307
populations of P. caldenia and P. flexuosa. Interspecific Nei’s genetic distance
between populations of P. caldenia, P. flexuosa and interspecific hybrids varied
between 0.099 and 1.534 and reflected that interspecific hybrids were more similar
genetically to P. caldenia (Velasco 2018). Structural analysis of P. caldenia, P. flexuosa and interspecific hybrids populations showed that genetic differentiation
between populations of these three species is moderate (0.15 < F ST < 0.25), thus
indicating that populations of P. caldenia have genetic coherence and preserve certain genetic isolation from P. flexuosa, although they hybridize in sympatry. These
results could reveal a kind of fragmentation within P. caldenia populations marked
by the presence of P. flexuosa in the stand (Velasco 2018).
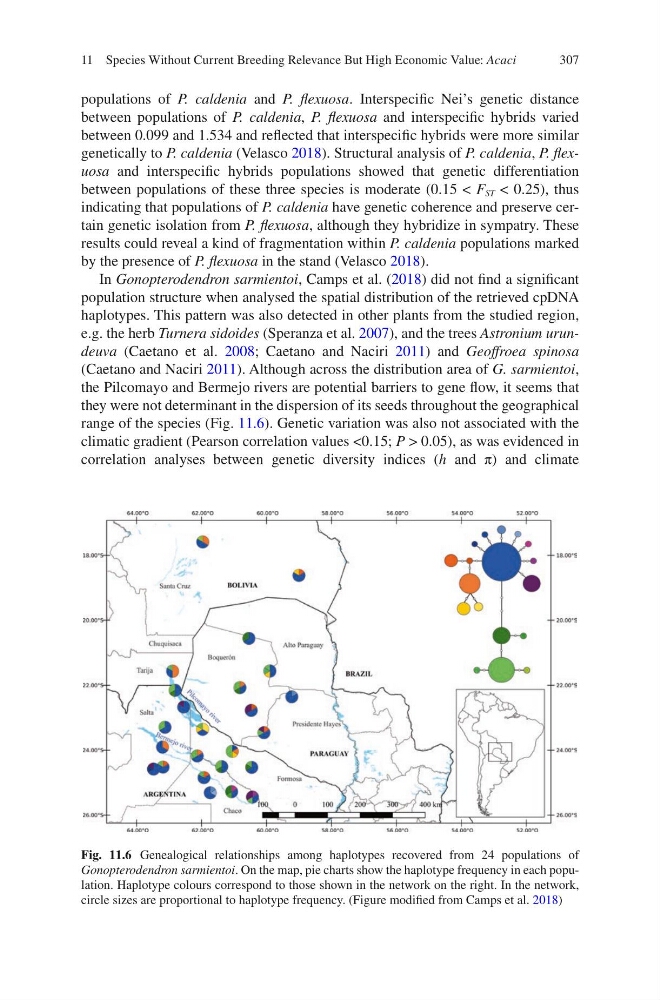
In Gonopterodendron sarmientoi, Camps et al. (2018) did not find a significant
population structure when analysed the spatial distribution of the retrieved cpDNA
haplotypes. This pattern was also detected in other plants from the studied region,
e.g. the herb Turnera sidoides (Speranza et al. 2007), and the trees Astronium urundeuva (Caetano et al. 2008; Caetano and Naciri 2011) and Geoffroea spinosa
(Caetano and Naciri 2011). Although across the distribution area of G. sarmientoi,
the Pilcomayo and Bermejo rivers are potential barriers to gene flow, it seems that
they were not determinant in the dispersion of its seeds throughout the geographical
range of the species (Fig. 11.6). Genetic variation was also not associated with the
climatic gradient (Pearson correlation values <0.15; P > 0.05), as was evidenced in
correlation analyses between genetic diversity indices (h and π) and climate
Fig. 11.6 Genealogical relationships among haplotypes recovered from 24 populations of
Gonopterodendron sarmientoi. On the map, pie charts show the haplotype frequency in each population. Haplotype colours correspond to those shown in the network on the right. In the network,
circle sizes are proportional to haplotype frequency. (Figure modified from Camps et al. 2018)
11 Species Without Current Breeding Relevance But High Economic Value: Acaci
populations of P. caldenia and P. flexuosa. Interspecific Nei’s genetic distance
between populations of P. caldenia, P. flexuosa and interspecific hybrids varied
between 0.099 and 1.534 and reflected that interspecific hybrids were more similar
genetically to P. caldenia (Velasco 2018). Structural analysis of P. caldenia, P. flexuosa and interspecific hybrids populations showed that genetic differentiation
between populations of these three species is moderate (0.15 < F ST < 0.25), thus
indicating that populations of P. caldenia have genetic coherence and preserve certain genetic isolation from P. flexuosa, although they hybridize in sympatry. These
results could reveal a kind of fragmentation within P. caldenia populations marked
by the presence of P. flexuosa in the stand (Velasco 2018).
In Gonopterodendron sarmientoi, Camps et al. (2018) did not find a significant
population structure when analysed the spatial distribution of the retrieved cpDNA
haplotypes. This pattern was also detected in other plants from the studied region,
e.g. the herb Turnera sidoides (Speranza et al. 2007), and the trees Astronium urundeuva (Caetano et al. 2008; Caetano and Naciri 2011) and Geoffroea spinosa
(Caetano and Naciri 2011). Although across the distribution area of G. sarmientoi,
the Pilcomayo and Bermejo rivers are potential barriers to gene flow, it seems that
they were not determinant in the dispersion of its seeds throughout the geographical
range of the species (Fig. 11.6). Genetic variation was also not associated with the
climatic gradient (Pearson correlation values <0.15; P > 0.05), as was evidenced in
correlation analyses between genetic diversity indices (h and π) and climate
Fig. 11.6 Genealogical relationships among haplotypes recovered from 24 populations of
Gonopterodendron sarmientoi. On the map, pie charts show the haplotype frequency in each population. Haplotype colours correspond to those shown in the network on the right. In the network,
circle sizes are proportional to haplotype frequency. (Figure modified from Camps et al. 2018)
11 Species Without Current Breeding Relevance But High Economic Value: Acaci