

222
of the twentieth century, the clearing responded to the settlement of farmers. They
received agricultural plots mostly in areas with rainfall greater than 800 mm and
they mainly engaged in rainfed production of cotton (in the Province of Chaco) and
beans (in the Province of Salta), using family labor (Galafassil 2005), or indigenous
labor in larger cases (Iñigo Carrera 2013). Additionally, some clearing in more arid
areas corresponded to livestock farming and irrigated agriculture.
According to an OEA report of 2009 (OEA, 2009), the areas between 750 and
900 mm of precipitation were already classified as being of high risk for agriculture,
taking into account the strong annual fluctuations in rainfall, with alternating periods of high and low humidity. For cleared areas below 900 mm there is a risk of
“reversion”, that is, abandonment of agricultural activity that gives rise to a secondary forest called “fachinal”, made up of a closed scrub, almost without grass and
practically worthless for livestock production (Cozzo 1995). The OEA report analyzes land clearings during the 1996–2004 period and concludes that 30 % of the
land cleared in that period presents a risk of “reversion”.
As mentioned, due to global climate change, a slight increase in the average
annual rainfall in the region is observed but at the same time a significant increase
in the occurrence of extreme drought events and heavy rains (IPCC 2014; MAyDS
2015). In this context, we can consider with a high degree of probability that the
clearings carried out below 700 mm in this region, in the medium term, will be
unfeasible for agricultural activity. This effect would be a consequence not only of
the fluctuations of the rains, but also of the deterioration of the soil that the dominant agricultural model in the region entails (Vallejos et al. 2017). It is proven that
the soils subjected to this type of exploitation suffer significant losses of organic
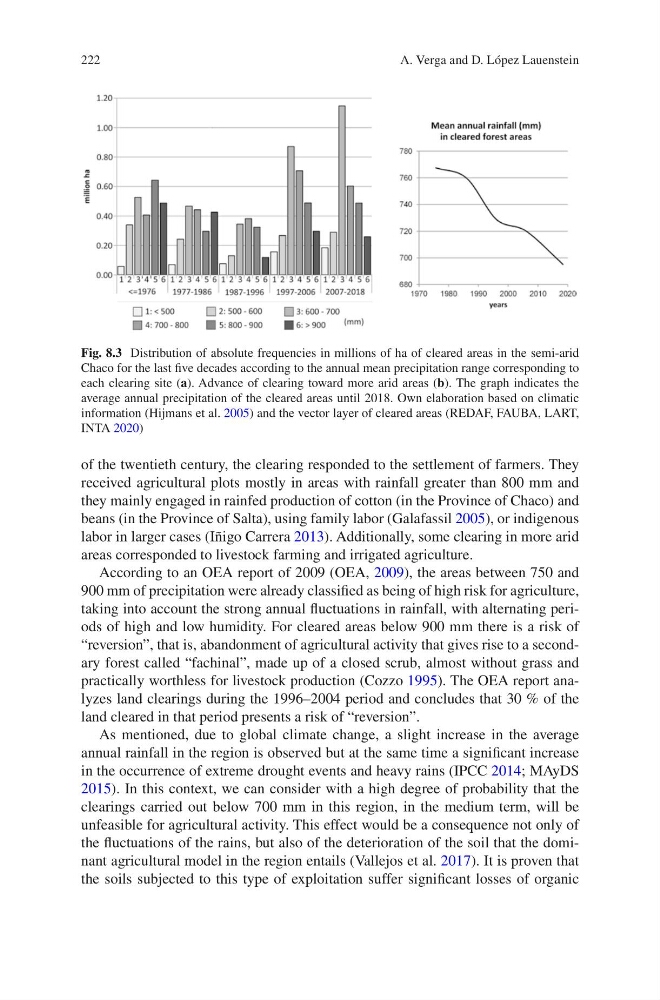
Fig. 8.3 Distribution of absolute frequencies in millions of ha of cleared areas in the semi-arid
Chaco for the last five decades according to the annual mean precipitation range corresponding to
each clearing site (a). Advance of clearing toward more arid areas (b). The graph indicates the
average annual precipitation of the cleared areas until 2018. Own elaboration based on climatic
information (Hijmans et al. 2005) and the vector layer of cleared areas (REDAF, FAUBA, LART,
INTA 2020)
A. Verga and D. López Lauenstein
of the twentieth century, the clearing responded to the settlement of farmers. They
received agricultural plots mostly in areas with rainfall greater than 800 mm and
they mainly engaged in rainfed production of cotton (in the Province of Chaco) and
beans (in the Province of Salta), using family labor (Galafassil 2005), or indigenous
labor in larger cases (Iñigo Carrera 2013). Additionally, some clearing in more arid
areas corresponded to livestock farming and irrigated agriculture.
According to an OEA report of 2009 (OEA, 2009), the areas between 750 and
900 mm of precipitation were already classified as being of high risk for agriculture,
taking into account the strong annual fluctuations in rainfall, with alternating periods of high and low humidity. For cleared areas below 900 mm there is a risk of
“reversion”, that is, abandonment of agricultural activity that gives rise to a secondary forest called “fachinal”, made up of a closed scrub, almost without grass and
practically worthless for livestock production (Cozzo 1995). The OEA report analyzes land clearings during the 1996–2004 period and concludes that 30 % of the
land cleared in that period presents a risk of “reversion”.
As mentioned, due to global climate change, a slight increase in the average
annual rainfall in the region is observed but at the same time a significant increase
in the occurrence of extreme drought events and heavy rains (IPCC 2014; MAyDS
2015). In this context, we can consider with a high degree of probability that the
clearings carried out below 700 mm in this region, in the medium term, will be
unfeasible for agricultural activity. This effect would be a consequence not only of
the fluctuations of the rains, but also of the deterioration of the soil that the dominant agricultural model in the region entails (Vallejos et al. 2017). It is proven that
the soils subjected to this type of exploitation suffer significant losses of organic
Fig. 8.3 Distribution of absolute frequencies in millions of ha of cleared areas in the semi-arid
Chaco for the last five decades according to the annual mean precipitation range corresponding to
each clearing site (a). Advance of clearing toward more arid areas (b). The graph indicates the
average annual precipitation of the cleared areas until 2018. Own elaboration based on climatic
information (Hijmans et al. 2005) and the vector layer of cleared areas (REDAF, FAUBA, LART,
INTA 2020)
A. Verga and D. López Lauenstein