

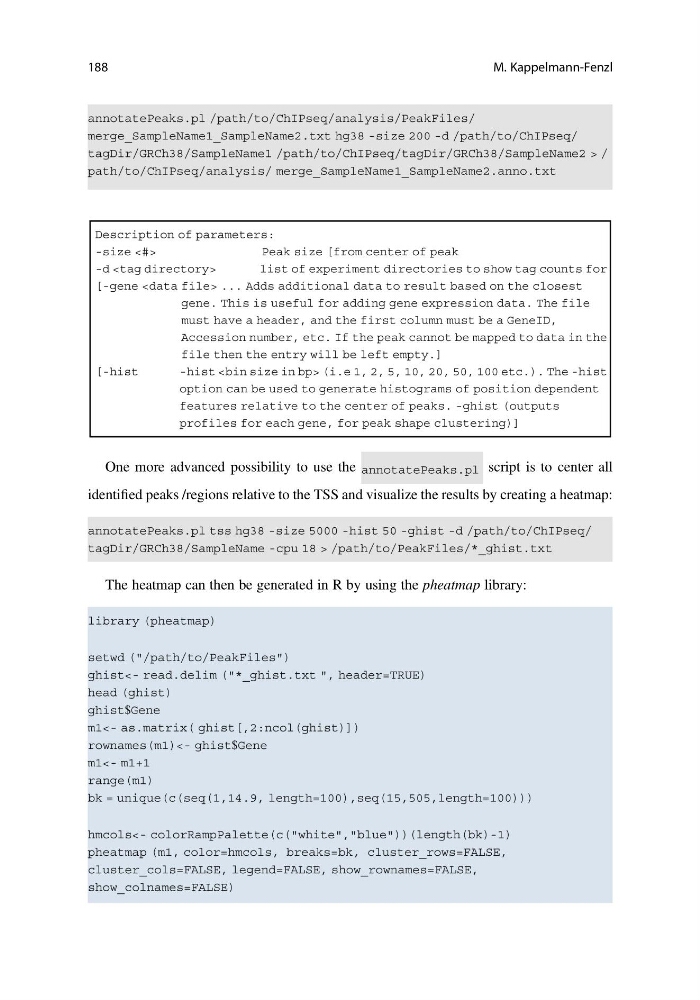
One more advanced possibility to use the
script is to center all
identified peaks /regions relative to the TSS and visualize the results by creating a heatmap:
The heatmap can then be generated in R by using the pheatmap library:
188
M. Kappelmann-Fenzl
script is to center all
identified peaks /regions relative to the TSS and visualize the results by creating a heatmap:
The heatmap can then be generated in R by using the pheatmap library:
188
M. Kappelmann-Fenzl