

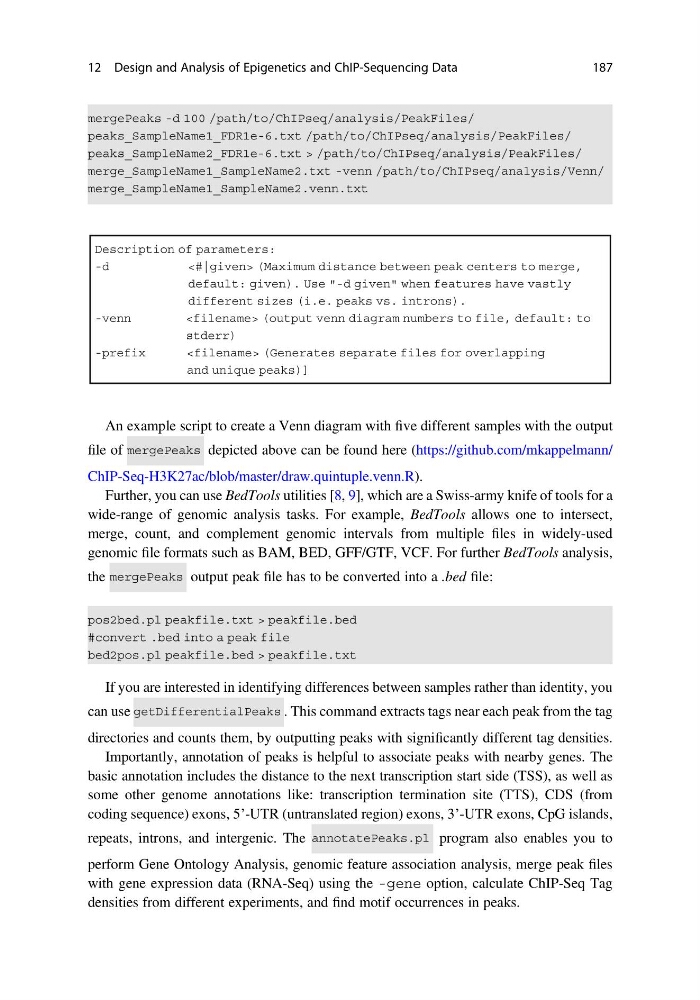
An example script to create a Venn diagram with five different samples with the output
file of
depicted above can be found here (https://github.com/mkappelmann/
ChIP-Seq-H3K27ac/blob/master/draw.quintuple.venn.R).
Further, you can use BedTools utilities [8, 9], which are a Swiss-army knife of tools for a
wide-range of genomic analysis tasks. For example, BedTools allows one to intersect,
merge, count, and complement genomic intervals from multiple files in widely-used
genomic file formats such as BAM, BED, GFF/GTF, VCF. For further BedTools analysis,
the
output peak file has to be converted into a .bed file:
If you are interested in identifying differences between samples rather than identity, you
can use
. This command extracts tags near each peak from the tag
directories and counts them, by outputting peaks with significantly different tag densities.
Importantly, annotation of peaks is helpful to associate peaks with nearby genes. The
basic annotation includes the distance to the next transcription start side (TSS), as well as
some other genome annotations like: transcription termination site (TTS), CDS (from
coding sequence) exons, 5’-UTR (untranslated region) exons, 3’-UTR exons, CpG islands,
repeats, introns, and intergenic. The
program also enables you to
perform Gene Ontology Analysis, genomic feature association analysis, merge peak files
with gene expression data (RNA-Seq) using the -gene option, calculate ChIP-Seq Tag
densities from different experiments, and find motif occurrences in peaks.
12 Design and Analysis of Epigenetics and ChIP-Sequencing Data
187
file of
depicted above can be found here (https://github.com/mkappelmann/
ChIP-Seq-H3K27ac/blob/master/draw.quintuple.venn.R).
Further, you can use BedTools utilities [8, 9], which are a Swiss-army knife of tools for a
wide-range of genomic analysis tasks. For example, BedTools allows one to intersect,
merge, count, and complement genomic intervals from multiple files in widely-used
genomic file formats such as BAM, BED, GFF/GTF, VCF. For further BedTools analysis,
the
output peak file has to be converted into a .bed file:
If you are interested in identifying differences between samples rather than identity, you
can use
. This command extracts tags near each peak from the tag
directories and counts them, by outputting peaks with significantly different tag densities.
Importantly, annotation of peaks is helpful to associate peaks with nearby genes. The
basic annotation includes the distance to the next transcription start side (TSS), as well as
some other genome annotations like: transcription termination site (TTS), CDS (from
coding sequence) exons, 5’-UTR (untranslated region) exons, 3’-UTR exons, CpG islands,
repeats, introns, and intergenic. The
program also enables you to
perform Gene Ontology Analysis, genomic feature association analysis, merge peak files
with gene expression data (RNA-Seq) using the -gene option, calculate ChIP-Seq Tag
densities from different experiments, and find motif occurrences in peaks.
12 Design and Analysis of Epigenetics and ChIP-Sequencing Data
187