

In the further course of this textbook we will use for both scenarios “peaks” and
“regions” on the name “peaks.”
12.6 Further ChIP-Seq Analysis
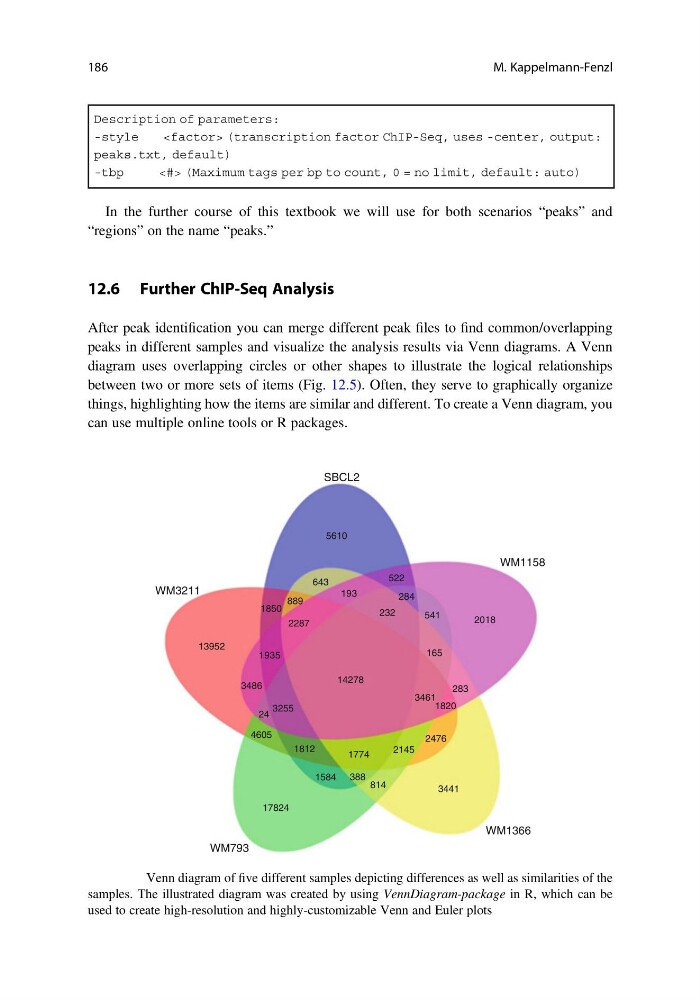
After peak identification you can merge different peak files to find common/overlapping
peaks in different samples and visualize the analysis results via Venn diagrams. A Venn
diagram uses overlapping circles or other shapes to illustrate the logical relationships
between two or more sets of items (Fig. 12.5). Often, they serve to graphically organize
things, highlighting how the items are similar and different. To create a Venn diagram, you
can use multiple online tools or R packages.
SBCL2
5610
522
643
1850
2287
3486
14278
24
4605
1584
17824
814
3441
2476
283
3461
1820
388
2145
1774
1812
3255
1935
13952
889
232
165
2018
541
284
193
WM3211
WM793
WM1366
WM1158
Fig. 12.5 Venn diagram of five different samples depicting differences as well as similarities of the
samples. The illustrated diagram was created by using VennDiagram-package in R, which can be
used to create high-resolution and highly-customizable Venn and Euler plots
186
M. Kappelmann-Fenzl
“regions” on the name “peaks.”
12.6 Further ChIP-Seq Analysis
After peak identification you can merge different peak files to find common/overlapping
peaks in different samples and visualize the analysis results via Venn diagrams. A Venn
diagram uses overlapping circles or other shapes to illustrate the logical relationships
between two or more sets of items (Fig. 12.5). Often, they serve to graphically organize
things, highlighting how the items are similar and different. To create a Venn diagram, you
can use multiple online tools or R packages.
SBCL2
5610
522
643
1850
2287
3486
14278
24
4605
1584
17824
814
3441
2476
283
3461
1820
388
2145
1774
1812
3255
1935
13952
889
232
165
2018
541
284
193
WM3211
WM793
WM1366
WM1158
Fig. 12.5 Venn diagram of five different samples depicting differences as well as similarities of the
samples. The illustrated diagram was created by using VennDiagram-package in R, which can be
used to create high-resolution and highly-customizable Venn and Euler plots
186
M. Kappelmann-Fenzl