

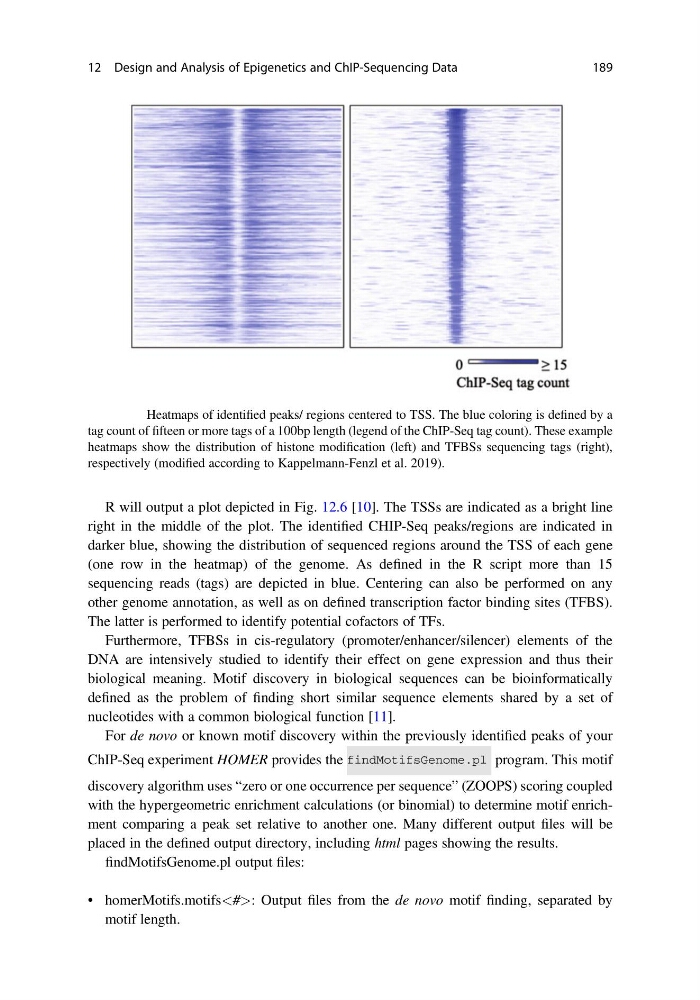
R will output a plot depicted in Fig. 12.6 [10]. The TSSs are indicated as a bright line
right in the middle of the plot. The identified CHIP-Seq peaks/regions are indicated in
darker blue, showing the distribution of sequenced regions around the TSS of each gene
(one row in the heatmap) of the genome. As defined in the R script more than 15
sequencing reads (tags) are depicted in blue. Centering can also be performed on any
other genome annotation, as well as on defined transcription factor binding sites (TFBS).
The latter is performed to identify potential cofactors of TFs.
Furthermore, TFBSs in cis-regulatory (promoter/enhancer/silencer) elements of the
DNA are intensively studied to identify their effect on gene expression and thus their
biological meaning. Motif discovery in biological sequences can be bioinformatically
defined as the problem of finding short similar sequence elements shared by a set of
nucleotides with a common biological function [11].
For de novo or known motif discovery within the previously identified peaks of your
ChIP-Seq experiment HOMER provides the
program. This motif
discovery algorithm uses “zero or one occurrence per sequence” (ZOOPS) scoring coupled
with the hypergeometric enrichment calculations (or binomial) to determine motif enrichment comparing a peak set relative to another one. Many different output files will be
placed in the defined output directory, including html pages showing the results.
findMotifsGenome.pl output files:
• homerMotifs.motifs<#>: Output files from the de novo motif finding, separated by
motif length.
Fig. 12.6 Heatmaps of identified peaks/ regions centered to TSS. The blue coloring is defined by a
tag count of fifteen or more tags of a 100bp length (legend of the ChIP-Seq tag count). These example
heatmaps show the distribution of histone modification (left) and TFBSs sequencing tags (right),
respectively (modified according to Kappelmann-Fenzl et al. 2019).
12 Design and Analysis of Epigenetics and ChIP-Sequencing Data
189
right in the middle of the plot. The identified CHIP-Seq peaks/regions are indicated in
darker blue, showing the distribution of sequenced regions around the TSS of each gene
(one row in the heatmap) of the genome. As defined in the R script more than 15
sequencing reads (tags) are depicted in blue. Centering can also be performed on any
other genome annotation, as well as on defined transcription factor binding sites (TFBS).
The latter is performed to identify potential cofactors of TFs.
Furthermore, TFBSs in cis-regulatory (promoter/enhancer/silencer) elements of the
DNA are intensively studied to identify their effect on gene expression and thus their
biological meaning. Motif discovery in biological sequences can be bioinformatically
defined as the problem of finding short similar sequence elements shared by a set of
nucleotides with a common biological function [11].
For de novo or known motif discovery within the previously identified peaks of your
ChIP-Seq experiment HOMER provides the
program. This motif
discovery algorithm uses “zero or one occurrence per sequence” (ZOOPS) scoring coupled
with the hypergeometric enrichment calculations (or binomial) to determine motif enrichment comparing a peak set relative to another one. Many different output files will be
placed in the defined output directory, including html pages showing the results.
findMotifsGenome.pl output files:
• homerMotifs.motifs<#>: Output files from the de novo motif finding, separated by
motif length.
Fig. 12.6 Heatmaps of identified peaks/ regions centered to TSS. The blue coloring is defined by a
tag count of fifteen or more tags of a 100bp length (legend of the ChIP-Seq tag count). These example
heatmaps show the distribution of histone modification (left) and TFBSs sequencing tags (right),
respectively (modified according to Kappelmann-Fenzl et al. 2019).
12 Design and Analysis of Epigenetics and ChIP-Sequencing Data
189