

7.3.1.5 Per Base Sequence Content
The plots below represent the percent of bases called for each of the four nucleotides (A/T/
G/C) at each position across all reads in the FASTQ file. Again, the x-axis is not uniform as
described for Per base sequence quality (see Sect. 7.3.1.2). In a random sequencing library,
you would expect that there would be almost no difference between the different bases of a
sequence run, so the lines in this plot should run parallel to each other. If strong biases are
detected which change in different bases this can usually be associated with a contamination of your library with overrepresented sequences, like clonal reads or adapters. Note that
in DNA-Seq libraries the proportion of each base remains relatively constant over the
length of a read (Fig. 7.11); however, most RNA-Seq libraries show a not uniform
distribution of bases for the first 10–15 nucleotides. This is normal and expected (Fig.
7.12).
7.3.1.6 Per Base GC Content
The per base GC content plots the GC content of each base position in a file. In a random
library the line in this plot should run horizontally. A consistent bias across all bases
indicates that the original library was sequence biased or indicates a systematic problem
during the sequencing run. A GC bias changing in different bases rather indicates a
contamination with overrepresented sequences.
80000
70000
60000
50000
40000
30000
20000
10000
0
2 3 4 5 6 7 8 9
12 13 14
16
18
20
22
Mean Sequence Quality (Phres Score)
Quality score distribution over all sequences
Average Quality per read
23 24
26
28
30
32 33 34
36
38
10
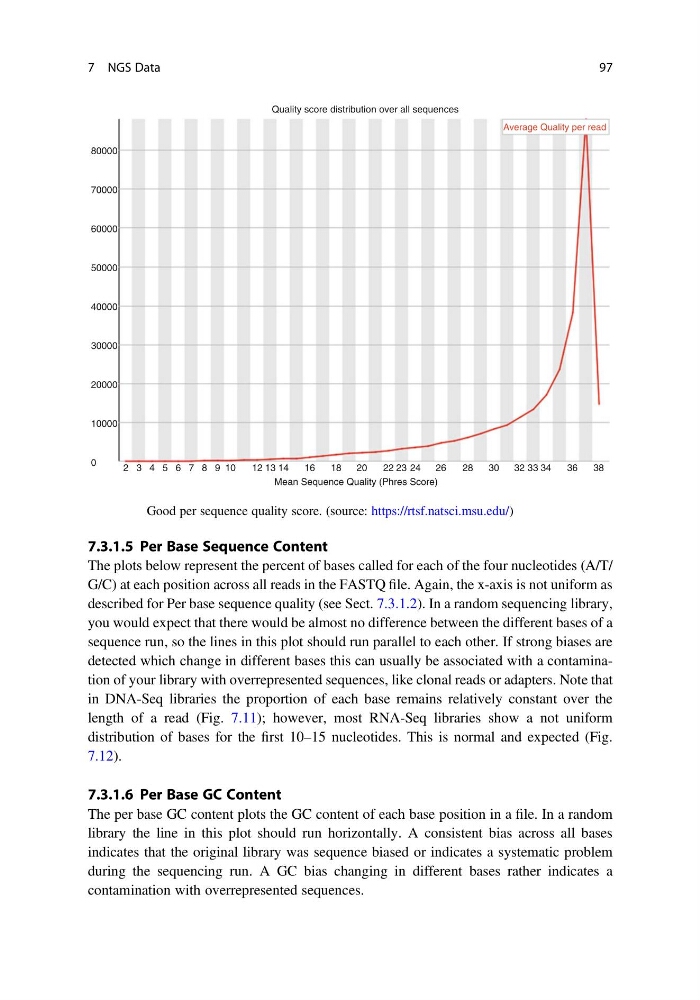
Fig. 7.10 Good per sequence quality score. (source: https://rtsf.natsci.msu.edu/)
7 NGS Data
97
The plots below represent the percent of bases called for each of the four nucleotides (A/T/
G/C) at each position across all reads in the FASTQ file. Again, the x-axis is not uniform as
described for Per base sequence quality (see Sect. 7.3.1.2). In a random sequencing library,
you would expect that there would be almost no difference between the different bases of a
sequence run, so the lines in this plot should run parallel to each other. If strong biases are
detected which change in different bases this can usually be associated with a contamination of your library with overrepresented sequences, like clonal reads or adapters. Note that
in DNA-Seq libraries the proportion of each base remains relatively constant over the
length of a read (Fig. 7.11); however, most RNA-Seq libraries show a not uniform
distribution of bases for the first 10–15 nucleotides. This is normal and expected (Fig.
7.12).
7.3.1.6 Per Base GC Content
The per base GC content plots the GC content of each base position in a file. In a random
library the line in this plot should run horizontally. A consistent bias across all bases
indicates that the original library was sequence biased or indicates a systematic problem
during the sequencing run. A GC bias changing in different bases rather indicates a
contamination with overrepresented sequences.
80000
70000
60000
50000
40000
30000
20000
10000
0
2 3 4 5 6 7 8 9
12 13 14
16
18
20
22
Mean Sequence Quality (Phres Score)
Quality score distribution over all sequences
Average Quality per read
23 24
26
28
30
32 33 34
36
38
10
Fig. 7.10 Good per sequence quality score. (source: https://rtsf.natsci.msu.edu/)
7 NGS Data
97