

more permanent problems such as smudges on the flowcell or debris inside the flow cell
lane.
7.3.1.4 Per Sequence Quality Scores
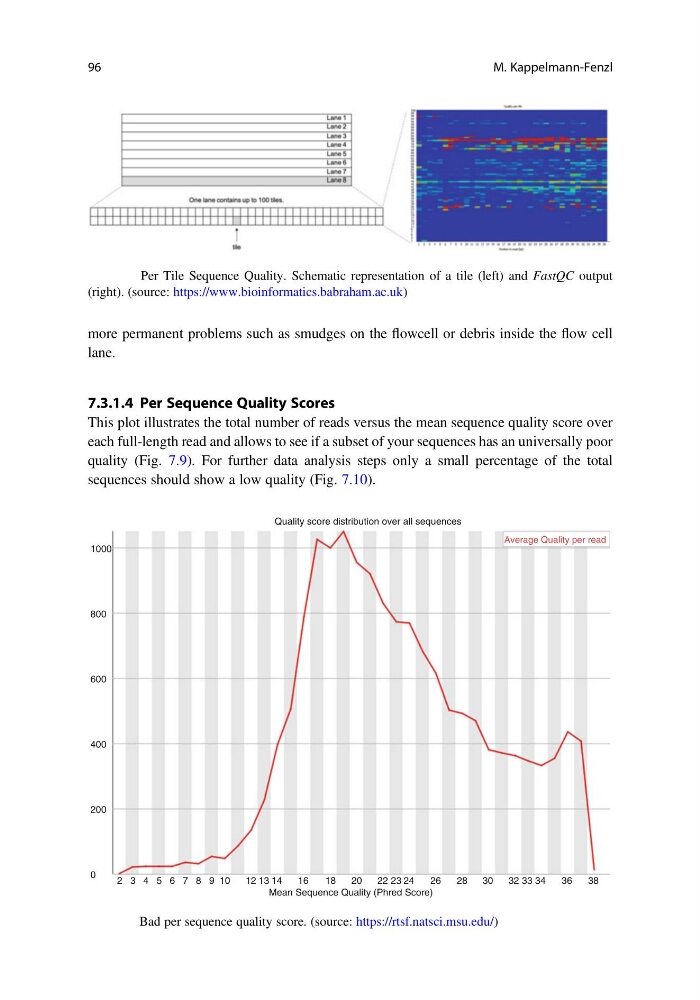
This plot illustrates the total number of reads versus the mean sequence quality score over
each full-length read and allows to see if a subset of your sequences has an universally poor
quality (Fig. 7.9). For further data analysis steps only a small percentage of the total
sequences should show a low quality (Fig. 7.10).
Fig. 7.8 Per Tile Sequence Quality. Schematic representation of a tile (left) and FastQC output
(right). (source: https://www.bioinformatics.babraham.ac.uk)
1000
800
600
400
200
0
2 3 4 5 6 7 8 9 10
12 13 14
16
18
Mean Sequence Quality (Phred Score)
Quality score distribution over all sequences
Average Quality per read
20
22 23 24
26
28
30
32 33 34
36
38
Fig. 7.9 Bad per sequence quality score. (source: https://rtsf.natsci.msu.edu/)
96
M. Kappelmann-Fenzl
lane.
7.3.1.4 Per Sequence Quality Scores
This plot illustrates the total number of reads versus the mean sequence quality score over
each full-length read and allows to see if a subset of your sequences has an universally poor
quality (Fig. 7.9). For further data analysis steps only a small percentage of the total
sequences should show a low quality (Fig. 7.10).
Fig. 7.8 Per Tile Sequence Quality. Schematic representation of a tile (left) and FastQC output
(right). (source: https://www.bioinformatics.babraham.ac.uk)
1000
800
600
400
200
0
2 3 4 5 6 7 8 9 10
12 13 14
16
18
Mean Sequence Quality (Phred Score)
Quality score distribution over all sequences
Average Quality per read
20
22 23 24
26
28
30
32 33 34
36
38
Fig. 7.9 Bad per sequence quality score. (source: https://rtsf.natsci.msu.edu/)
96
M. Kappelmann-Fenzl