

9. Plot k obs vs. [X tot ]. If the reaction conforms to Scheme B, the
plot will be linear with slope k 1 and intercept k À1 (see Note 9).
It is important that the largest possible concentration range be
covered because the demonstration that k obs varies linearly over
an extended concentration range is necessary to confirm that
Scheme B is an adequate description of the process.
3.1.1 Results
and Common Problems
Although the use of a large range of [X tot ] should permit accurate
determination of both kinetic constants this will not always be the
case. For low-affinity interactions, where the dissociation rate constant (k À1 ) is likely to be large, it may be possible to cover only a
limited range of [X tot ] before k obs becomes too fast to measure and
the association rate constant (k 1 ) will not be accurately determined.
A very common problem with high-affinity interactions is that the
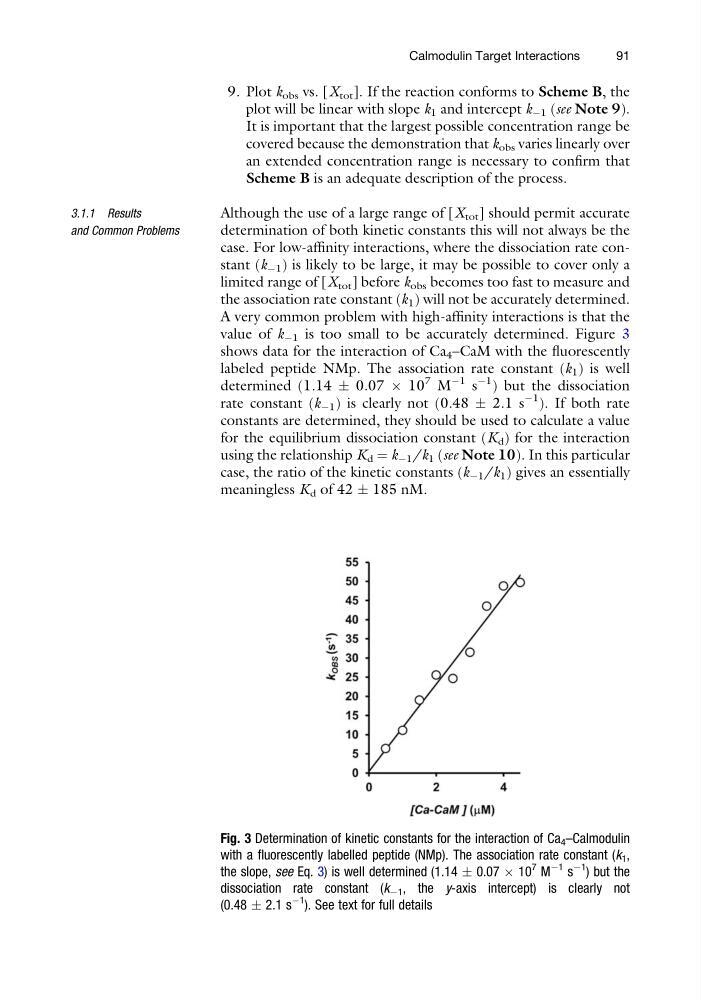
value of k À1 is too small to be accurately determined. Figure 3
shows data for the interaction of Ca 4 –CaM with the fluorescently
labeled peptide NMp. The association rate constant (k 1 ) is well
determined (1.14 Æ 0.07 Â 10
7 M
À1 s
À1 ) but the dissociation
rate constant (k À1 ) is clearly not (0.48 Æ 2.1 s
À1
). If both rate
constants are determined, they should be used to calculate a value
for the equilibrium dissociation constant (K d ) for the interaction
using the relationship K d ¼ k À1 /k 1 (see Note 10). In this particular
case, the ratio of the kinetic constants (k À1 /k 1 ) gives an essentially
meaningless K d of 42 Æ 185 nM.
Fig. 3 Determination of kinetic constants for the interaction of Ca 4 –Calmodulin
with a fluorescently labelled peptide (NMp). The association rate constant (k 1 ,
the slope, see Eq. 3) is well determined (1.14 Æ 0.07 Â 10
7
M
À1
s
À1
) but the
dissociation rate constant (k À1 , the y-axis intercept) is clearly not
(0.48 Æ 2.1 s
À1
). See text for full details
Calmodulin Target Interactions
91
plot will be linear with slope k 1 and intercept k À1 (see Note 9).
It is important that the largest possible concentration range be
covered because the demonstration that k obs varies linearly over
an extended concentration range is necessary to confirm that
Scheme B is an adequate description of the process.
3.1.1 Results
and Common Problems
Although the use of a large range of [X tot ] should permit accurate
determination of both kinetic constants this will not always be the
case. For low-affinity interactions, where the dissociation rate constant (k À1 ) is likely to be large, it may be possible to cover only a
limited range of [X tot ] before k obs becomes too fast to measure and
the association rate constant (k 1 ) will not be accurately determined.
A very common problem with high-affinity interactions is that the
value of k À1 is too small to be accurately determined. Figure 3
shows data for the interaction of Ca 4 –CaM with the fluorescently
labeled peptide NMp. The association rate constant (k 1 ) is well
determined (1.14 Æ 0.07 Â 10
7 M
À1 s
À1 ) but the dissociation
rate constant (k À1 ) is clearly not (0.48 Æ 2.1 s
À1
). If both rate
constants are determined, they should be used to calculate a value
for the equilibrium dissociation constant (K d ) for the interaction
using the relationship K d ¼ k À1 /k 1 (see Note 10). In this particular
case, the ratio of the kinetic constants (k À1 /k 1 ) gives an essentially
meaningless K d of 42 Æ 185 nM.
Fig. 3 Determination of kinetic constants for the interaction of Ca 4 –Calmodulin
with a fluorescently labelled peptide (NMp). The association rate constant (k 1 ,
the slope, see Eq. 3) is well determined (1.14 Æ 0.07 Â 10
7
M
À1
s
À1
) but the
dissociation rate constant (k À1 , the y-axis intercept) is clearly not
(0.48 Æ 2.1 s
À1
). See text for full details
Calmodulin Target Interactions
91